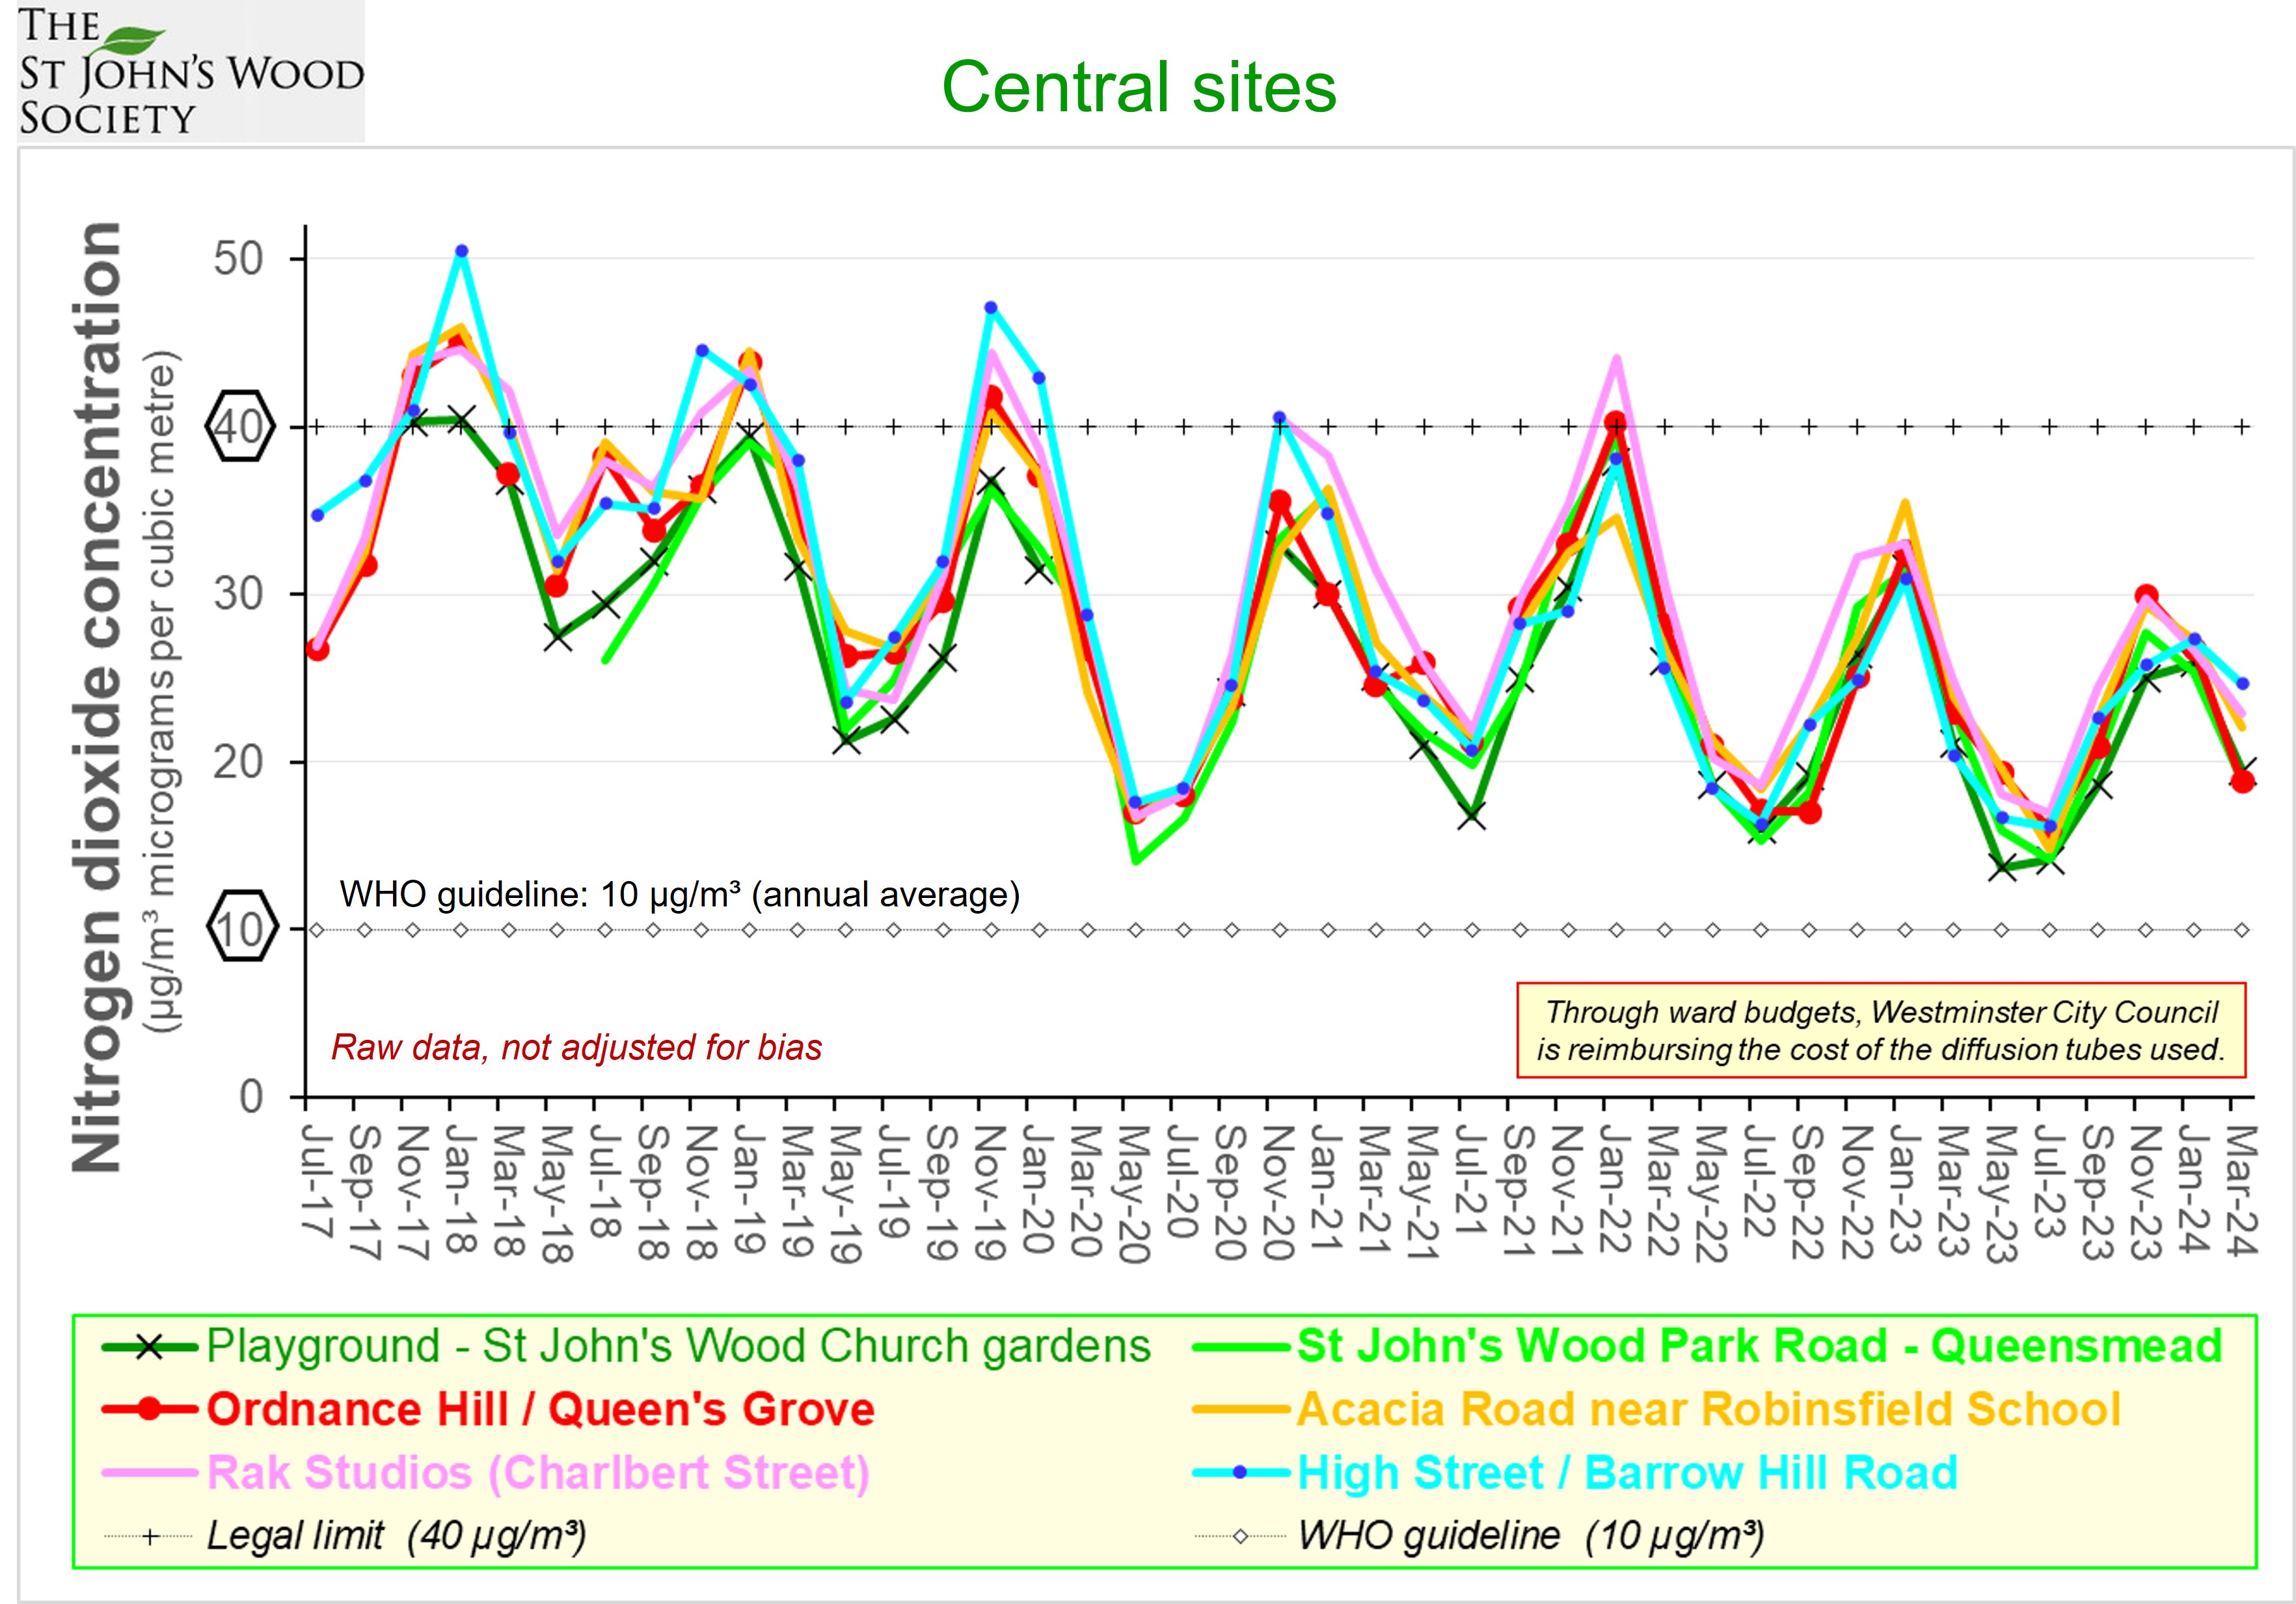
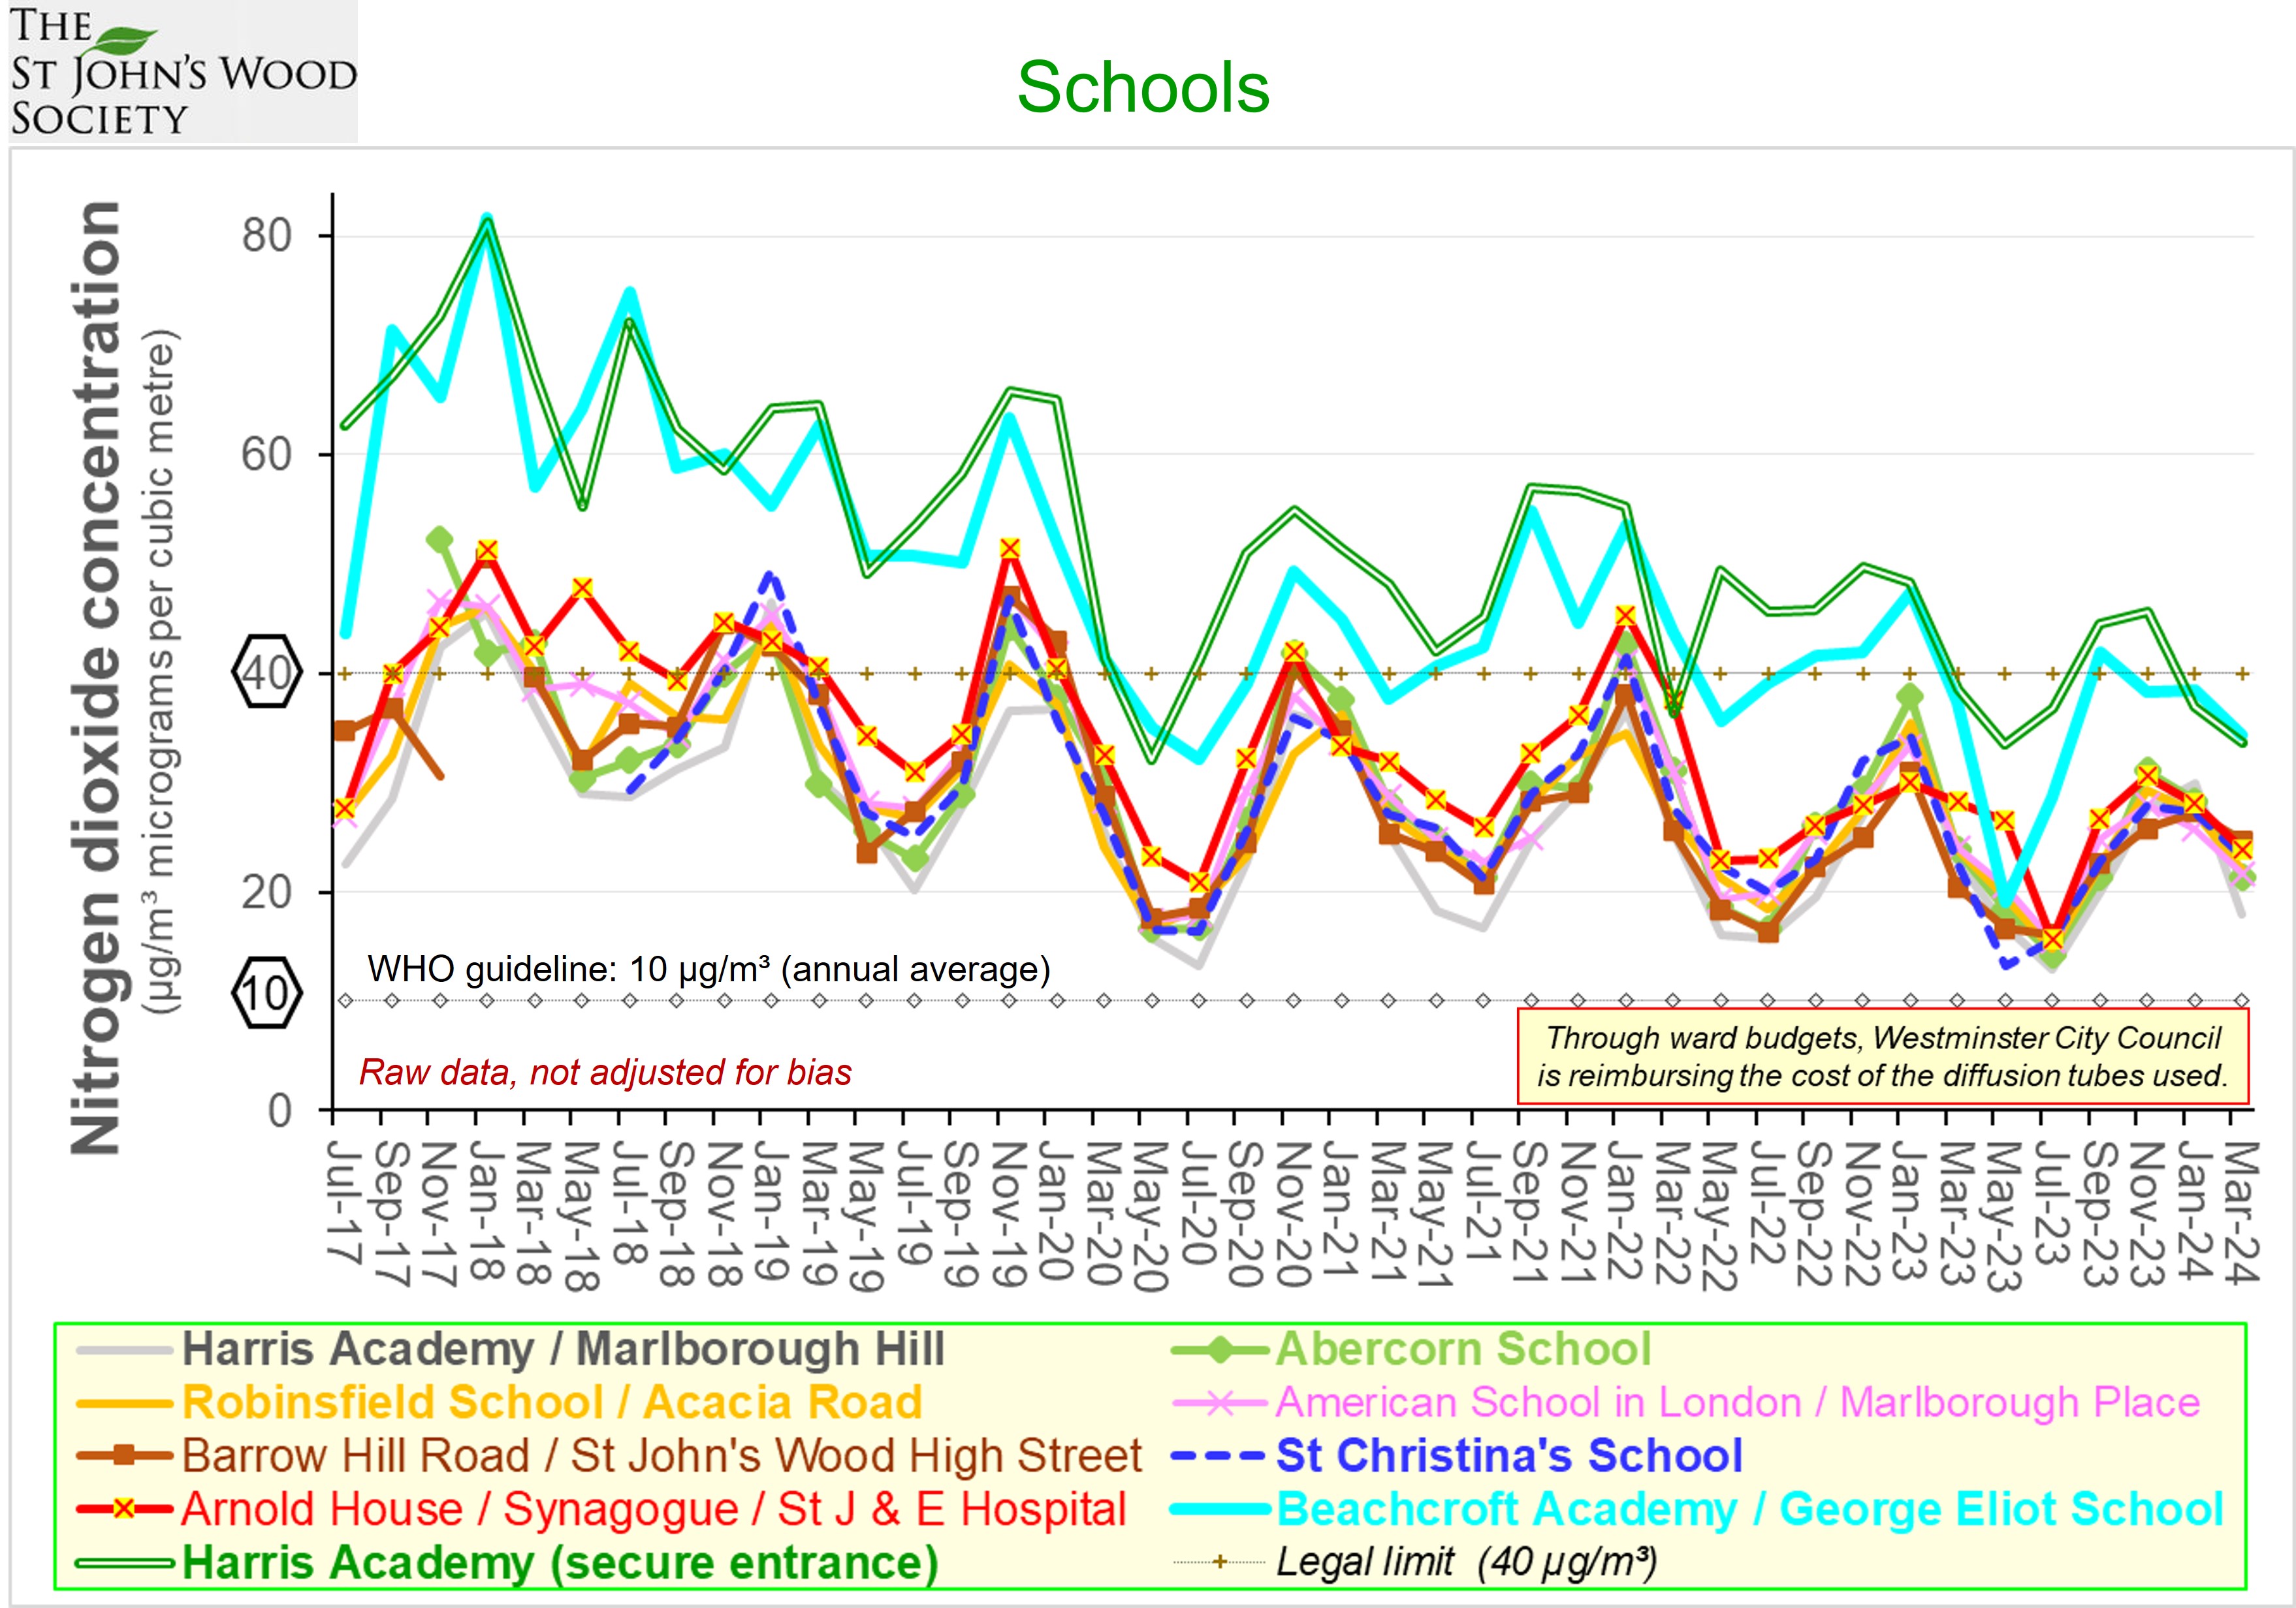
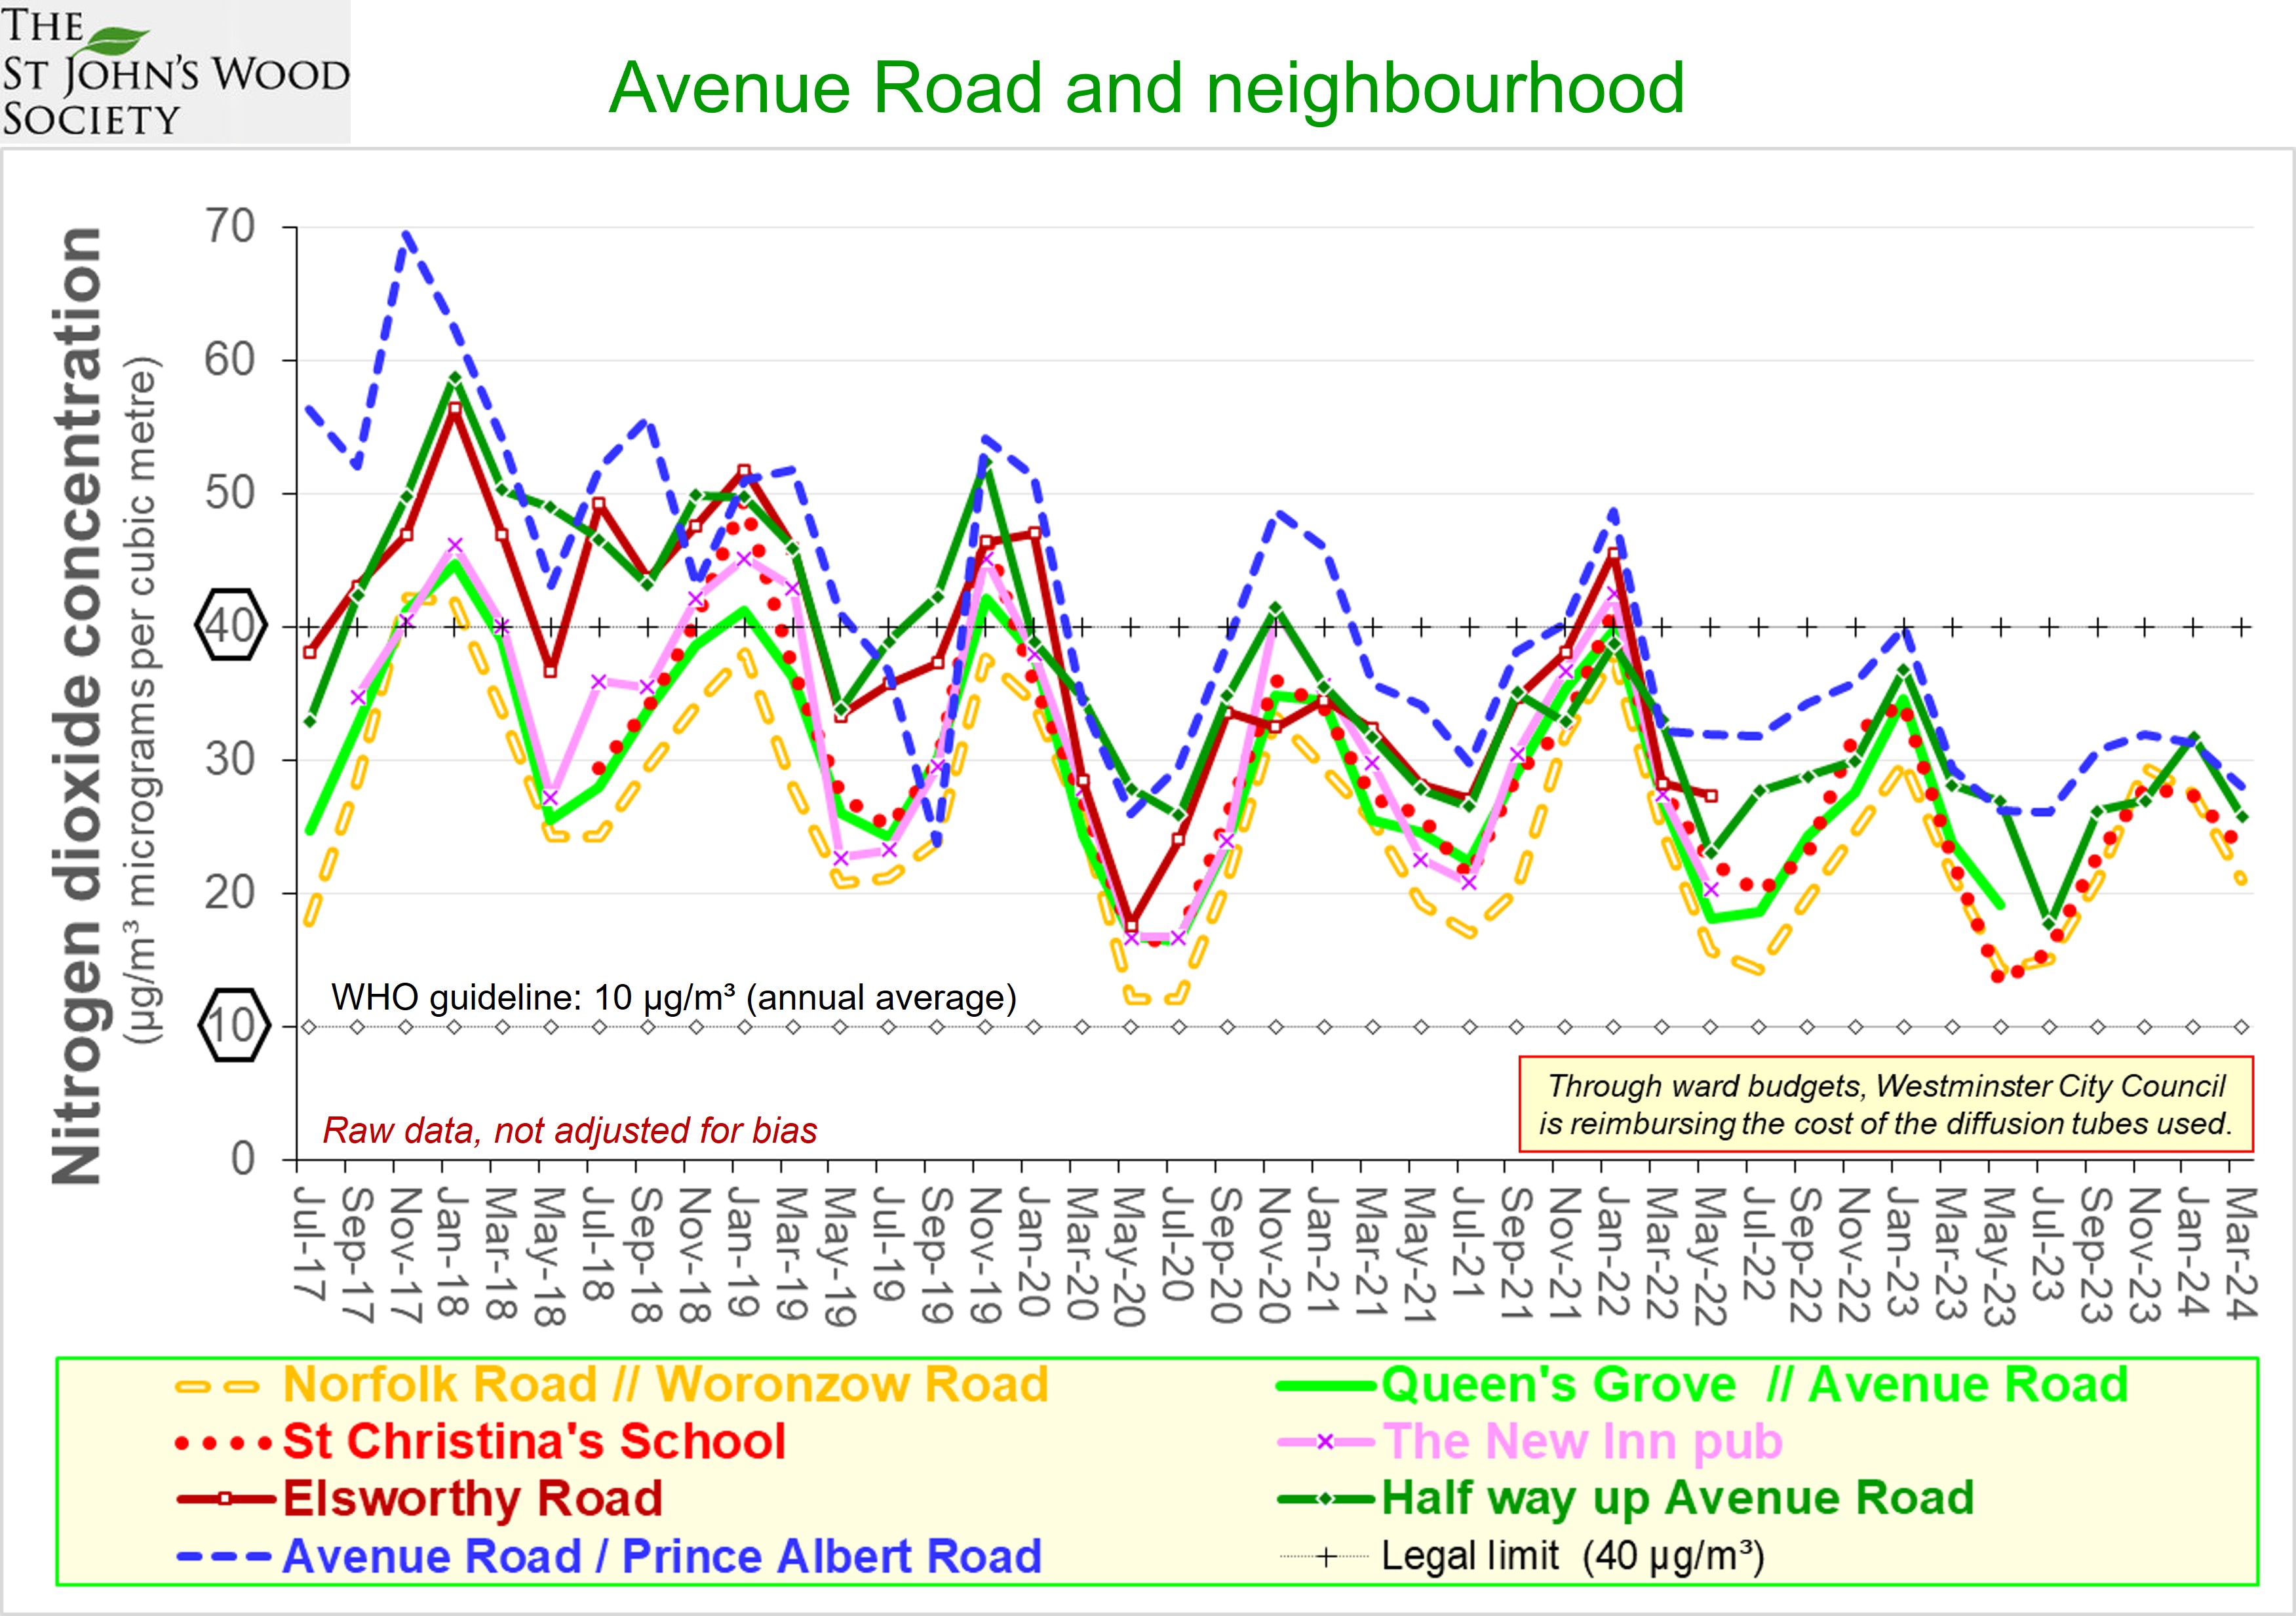
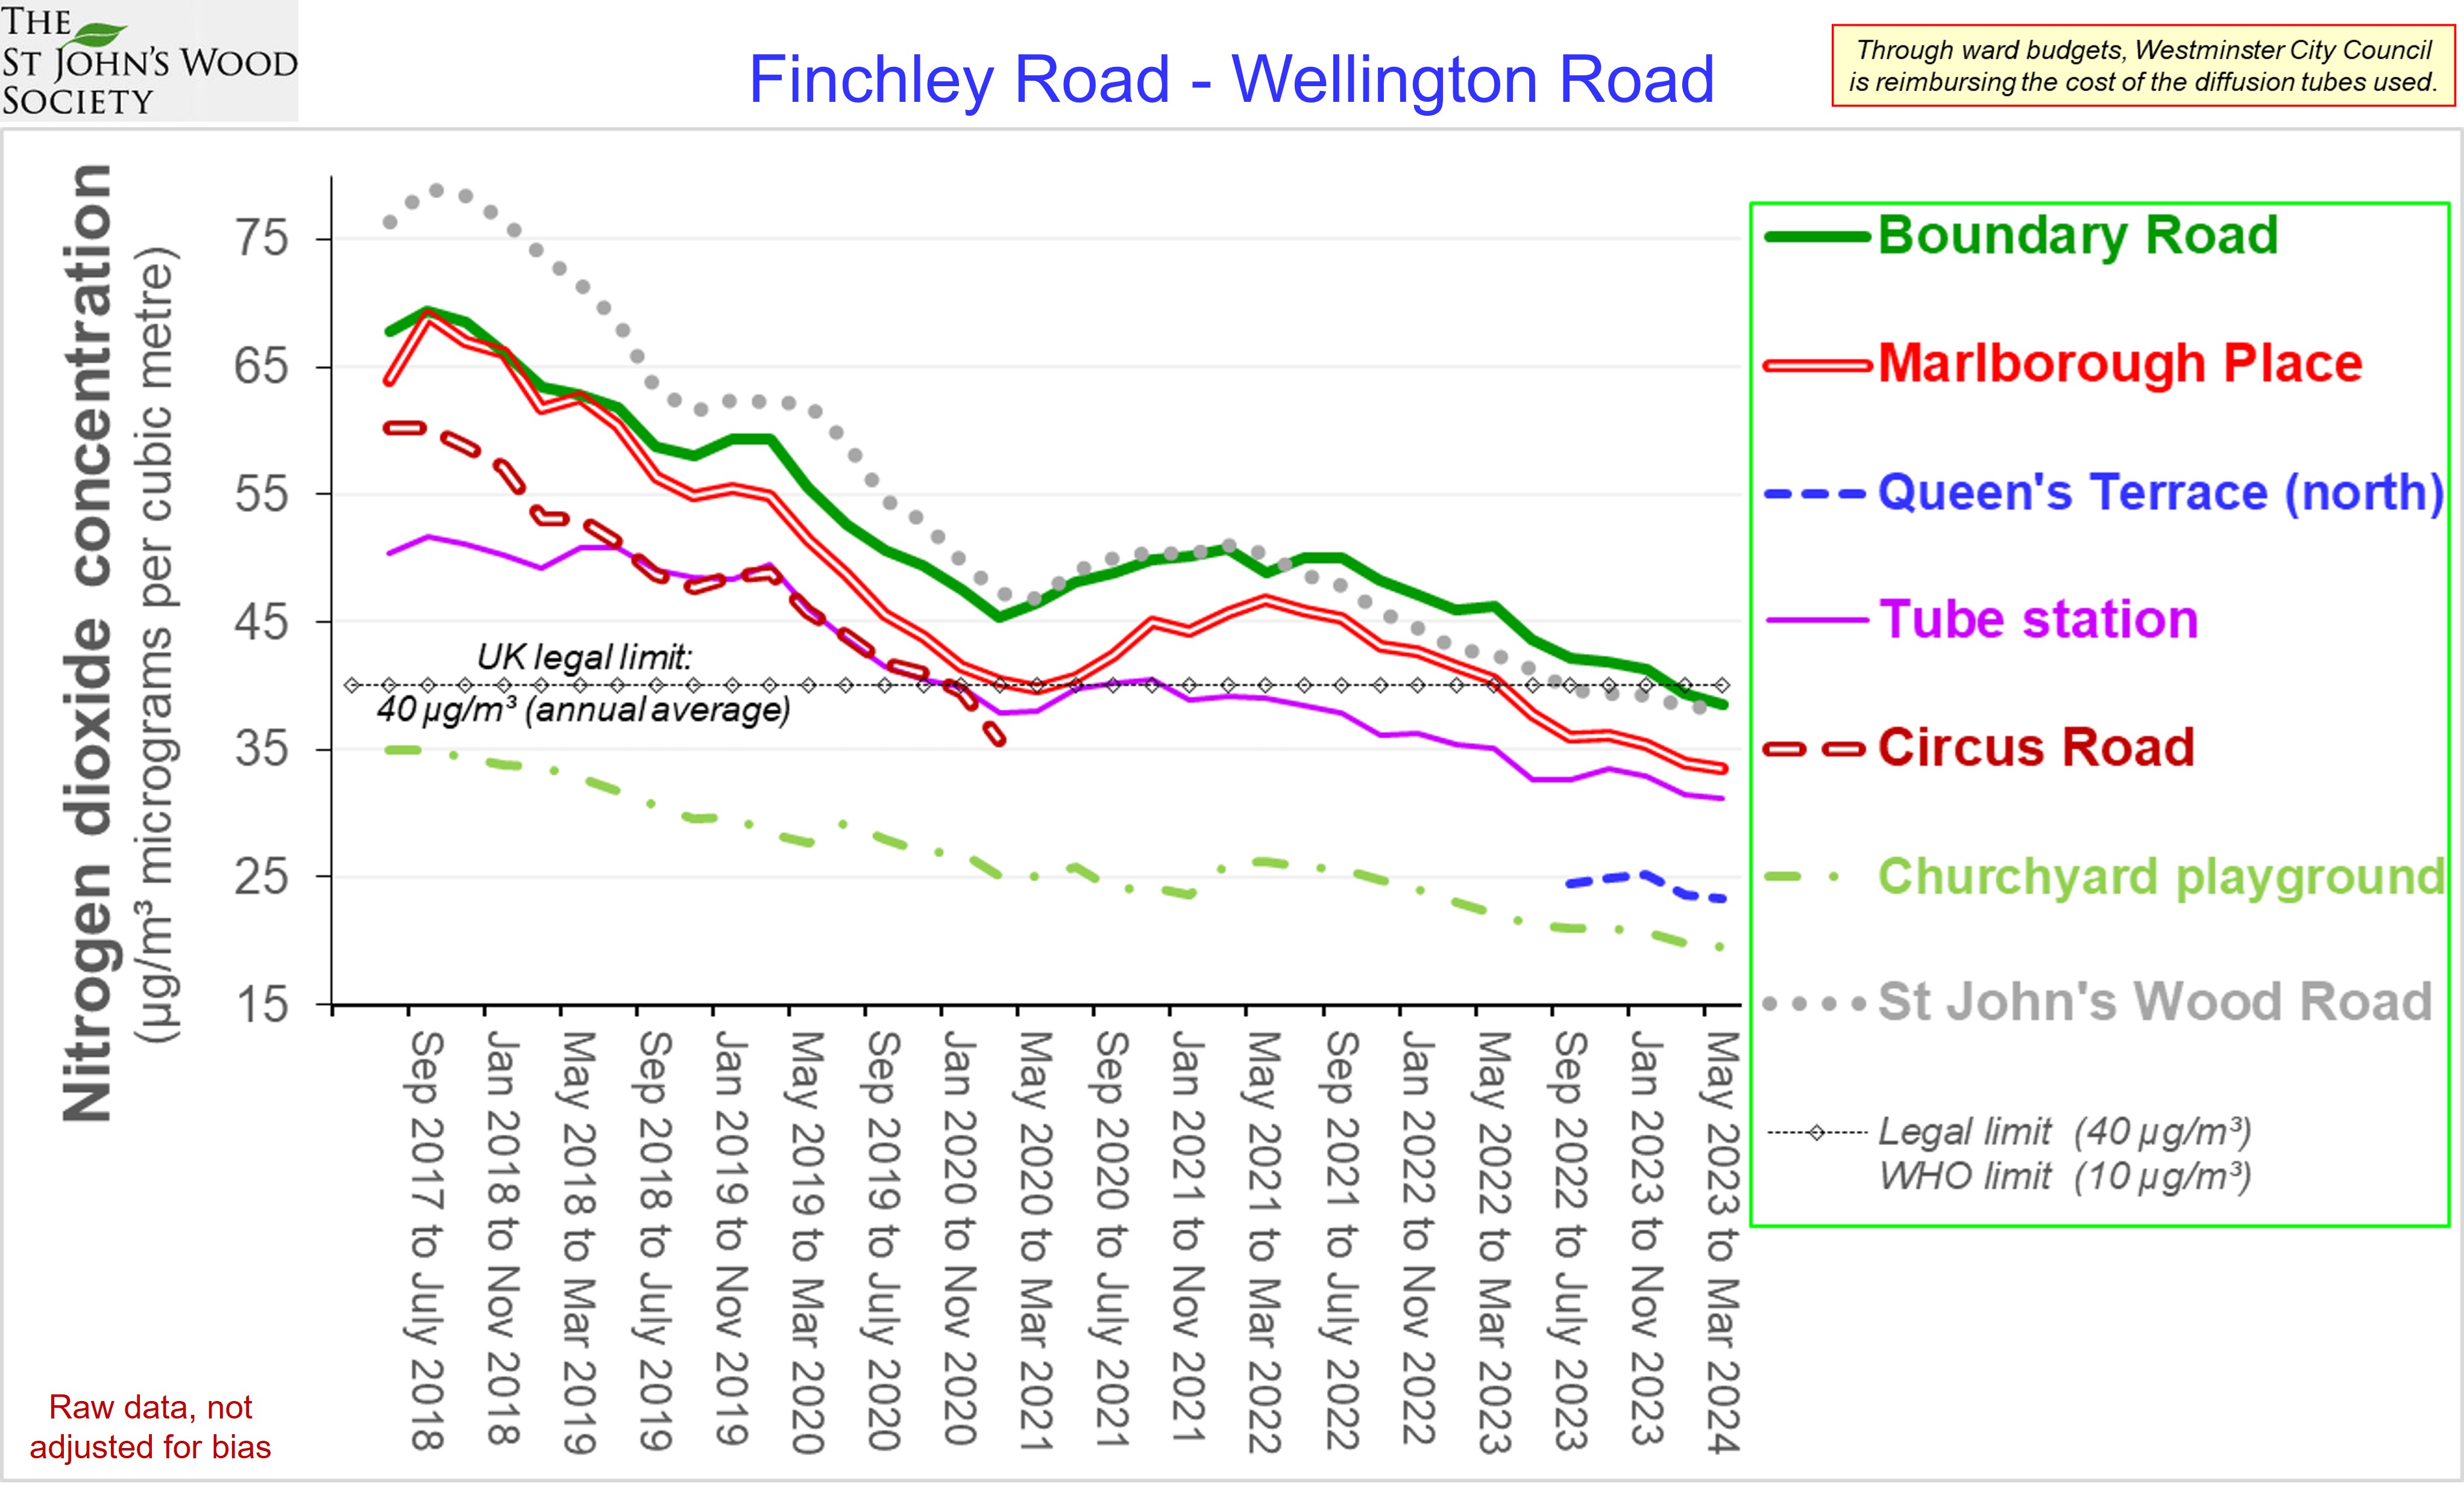
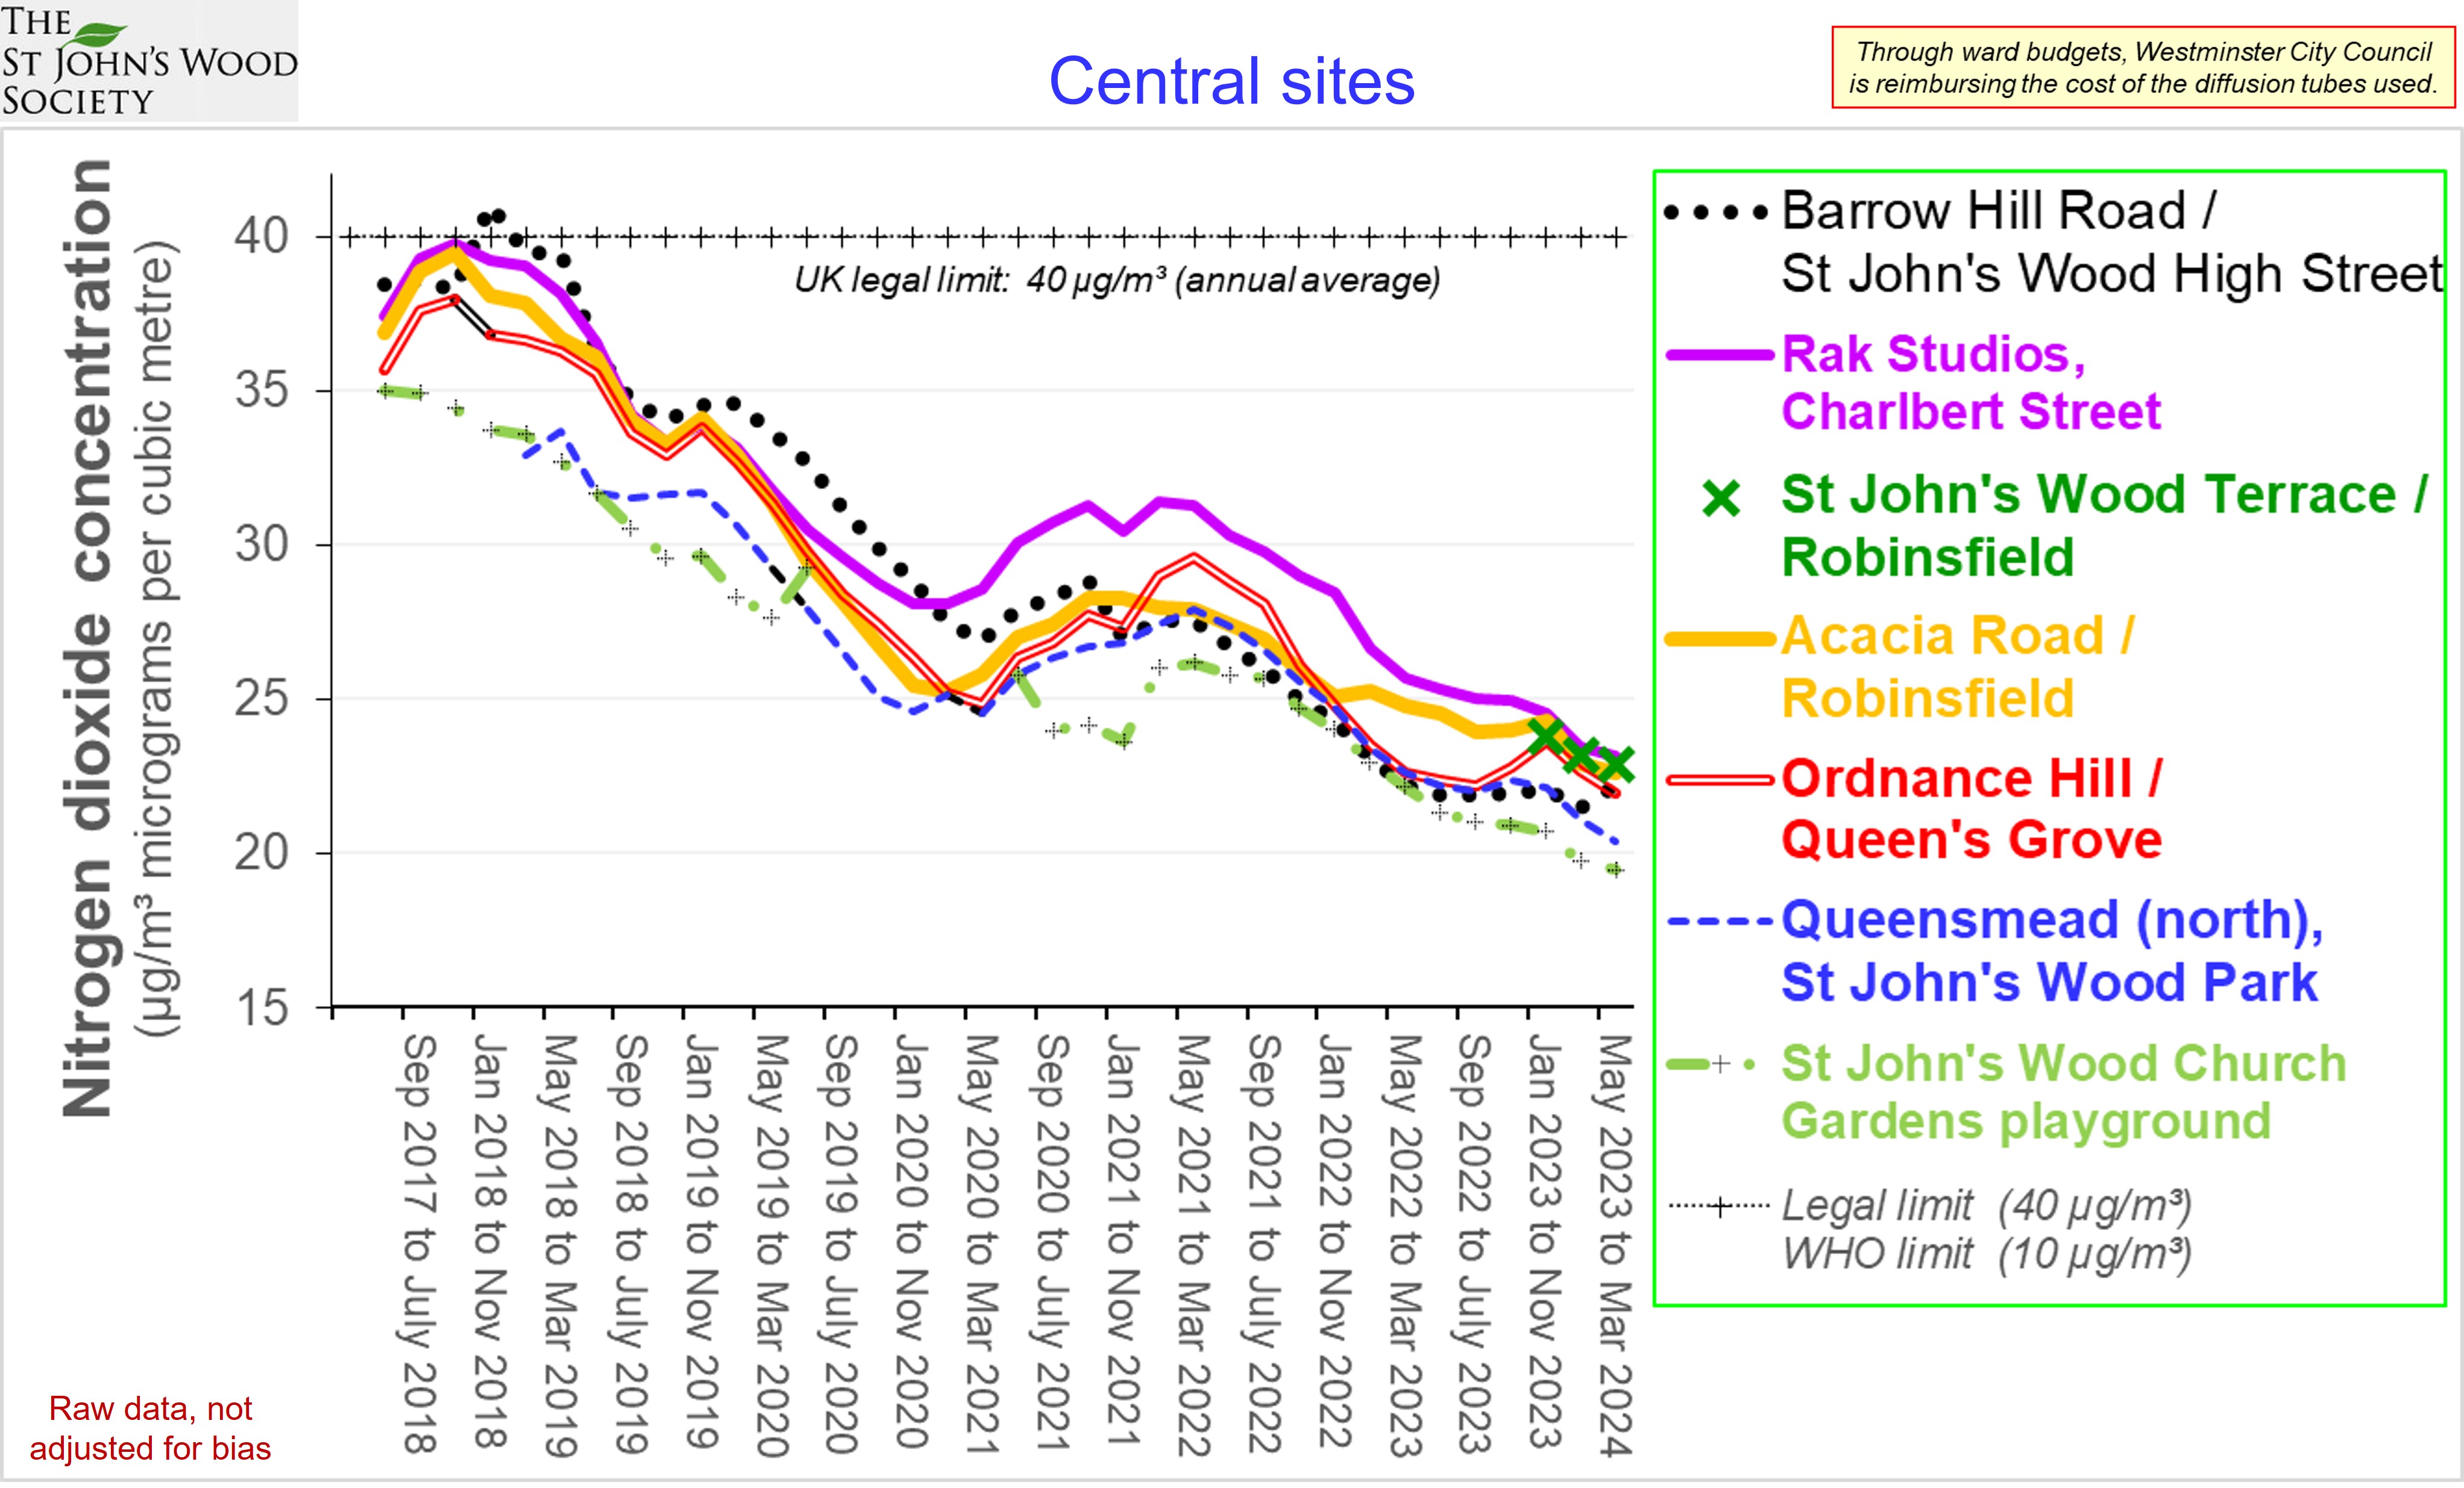
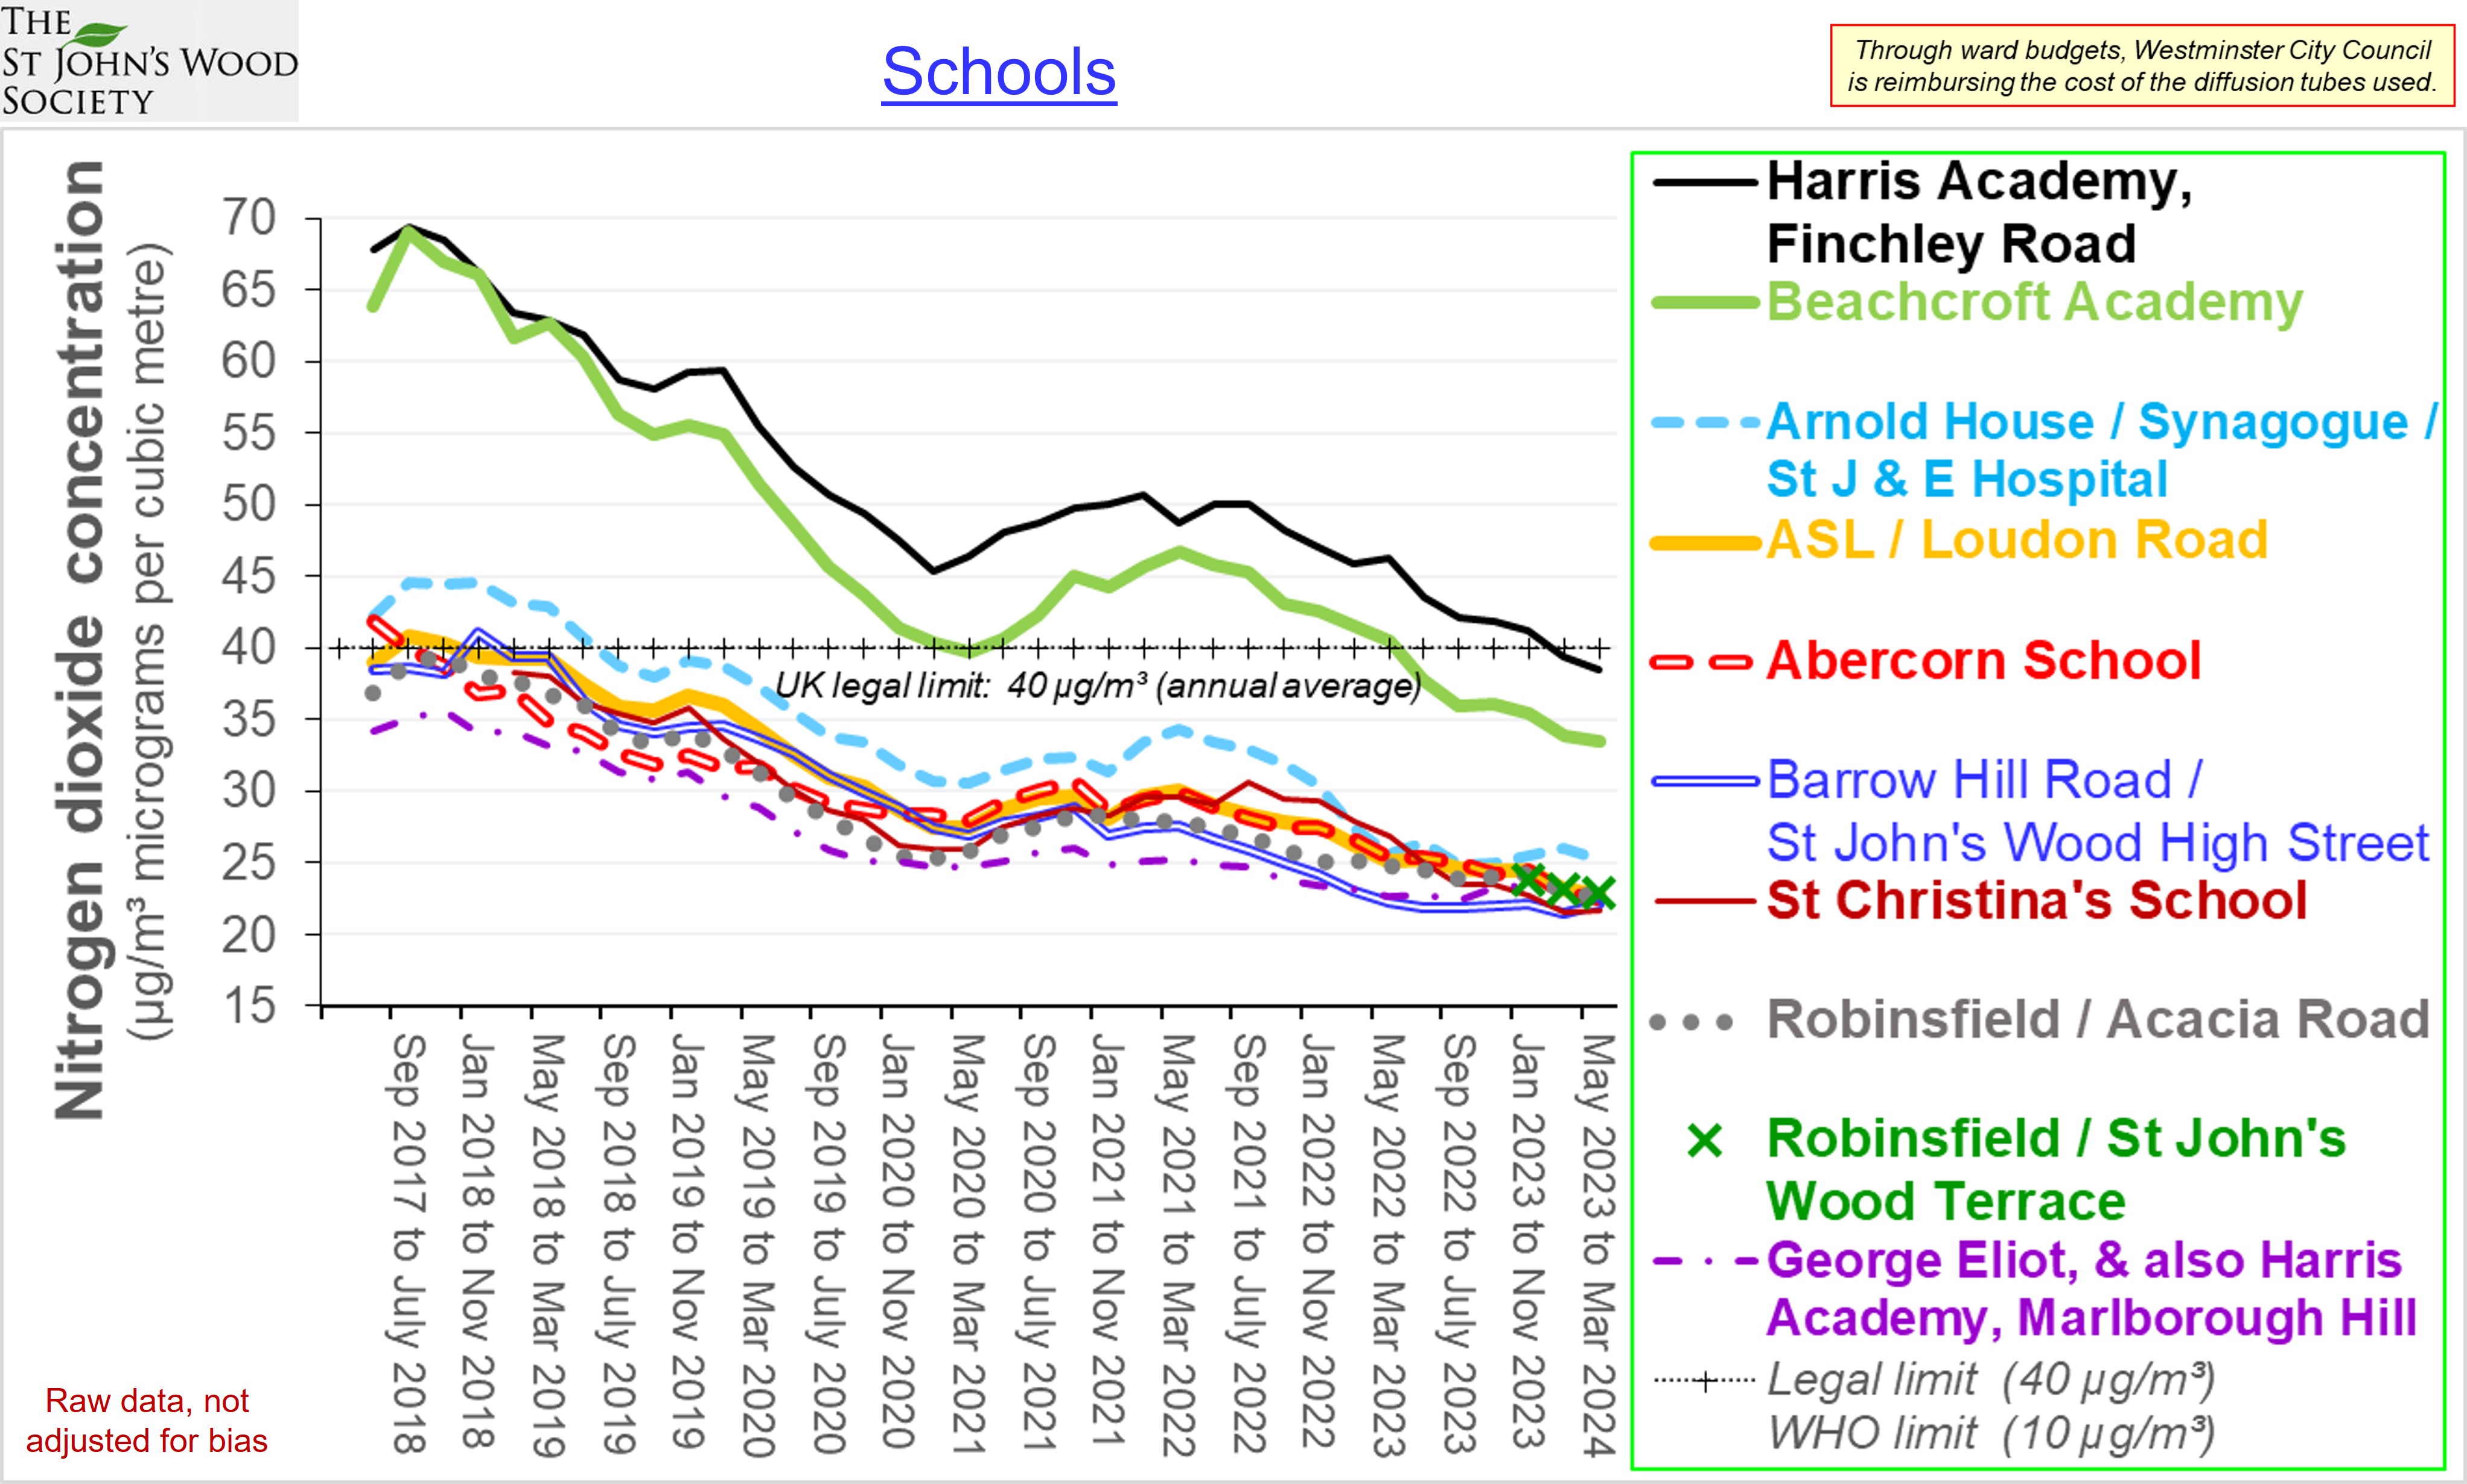
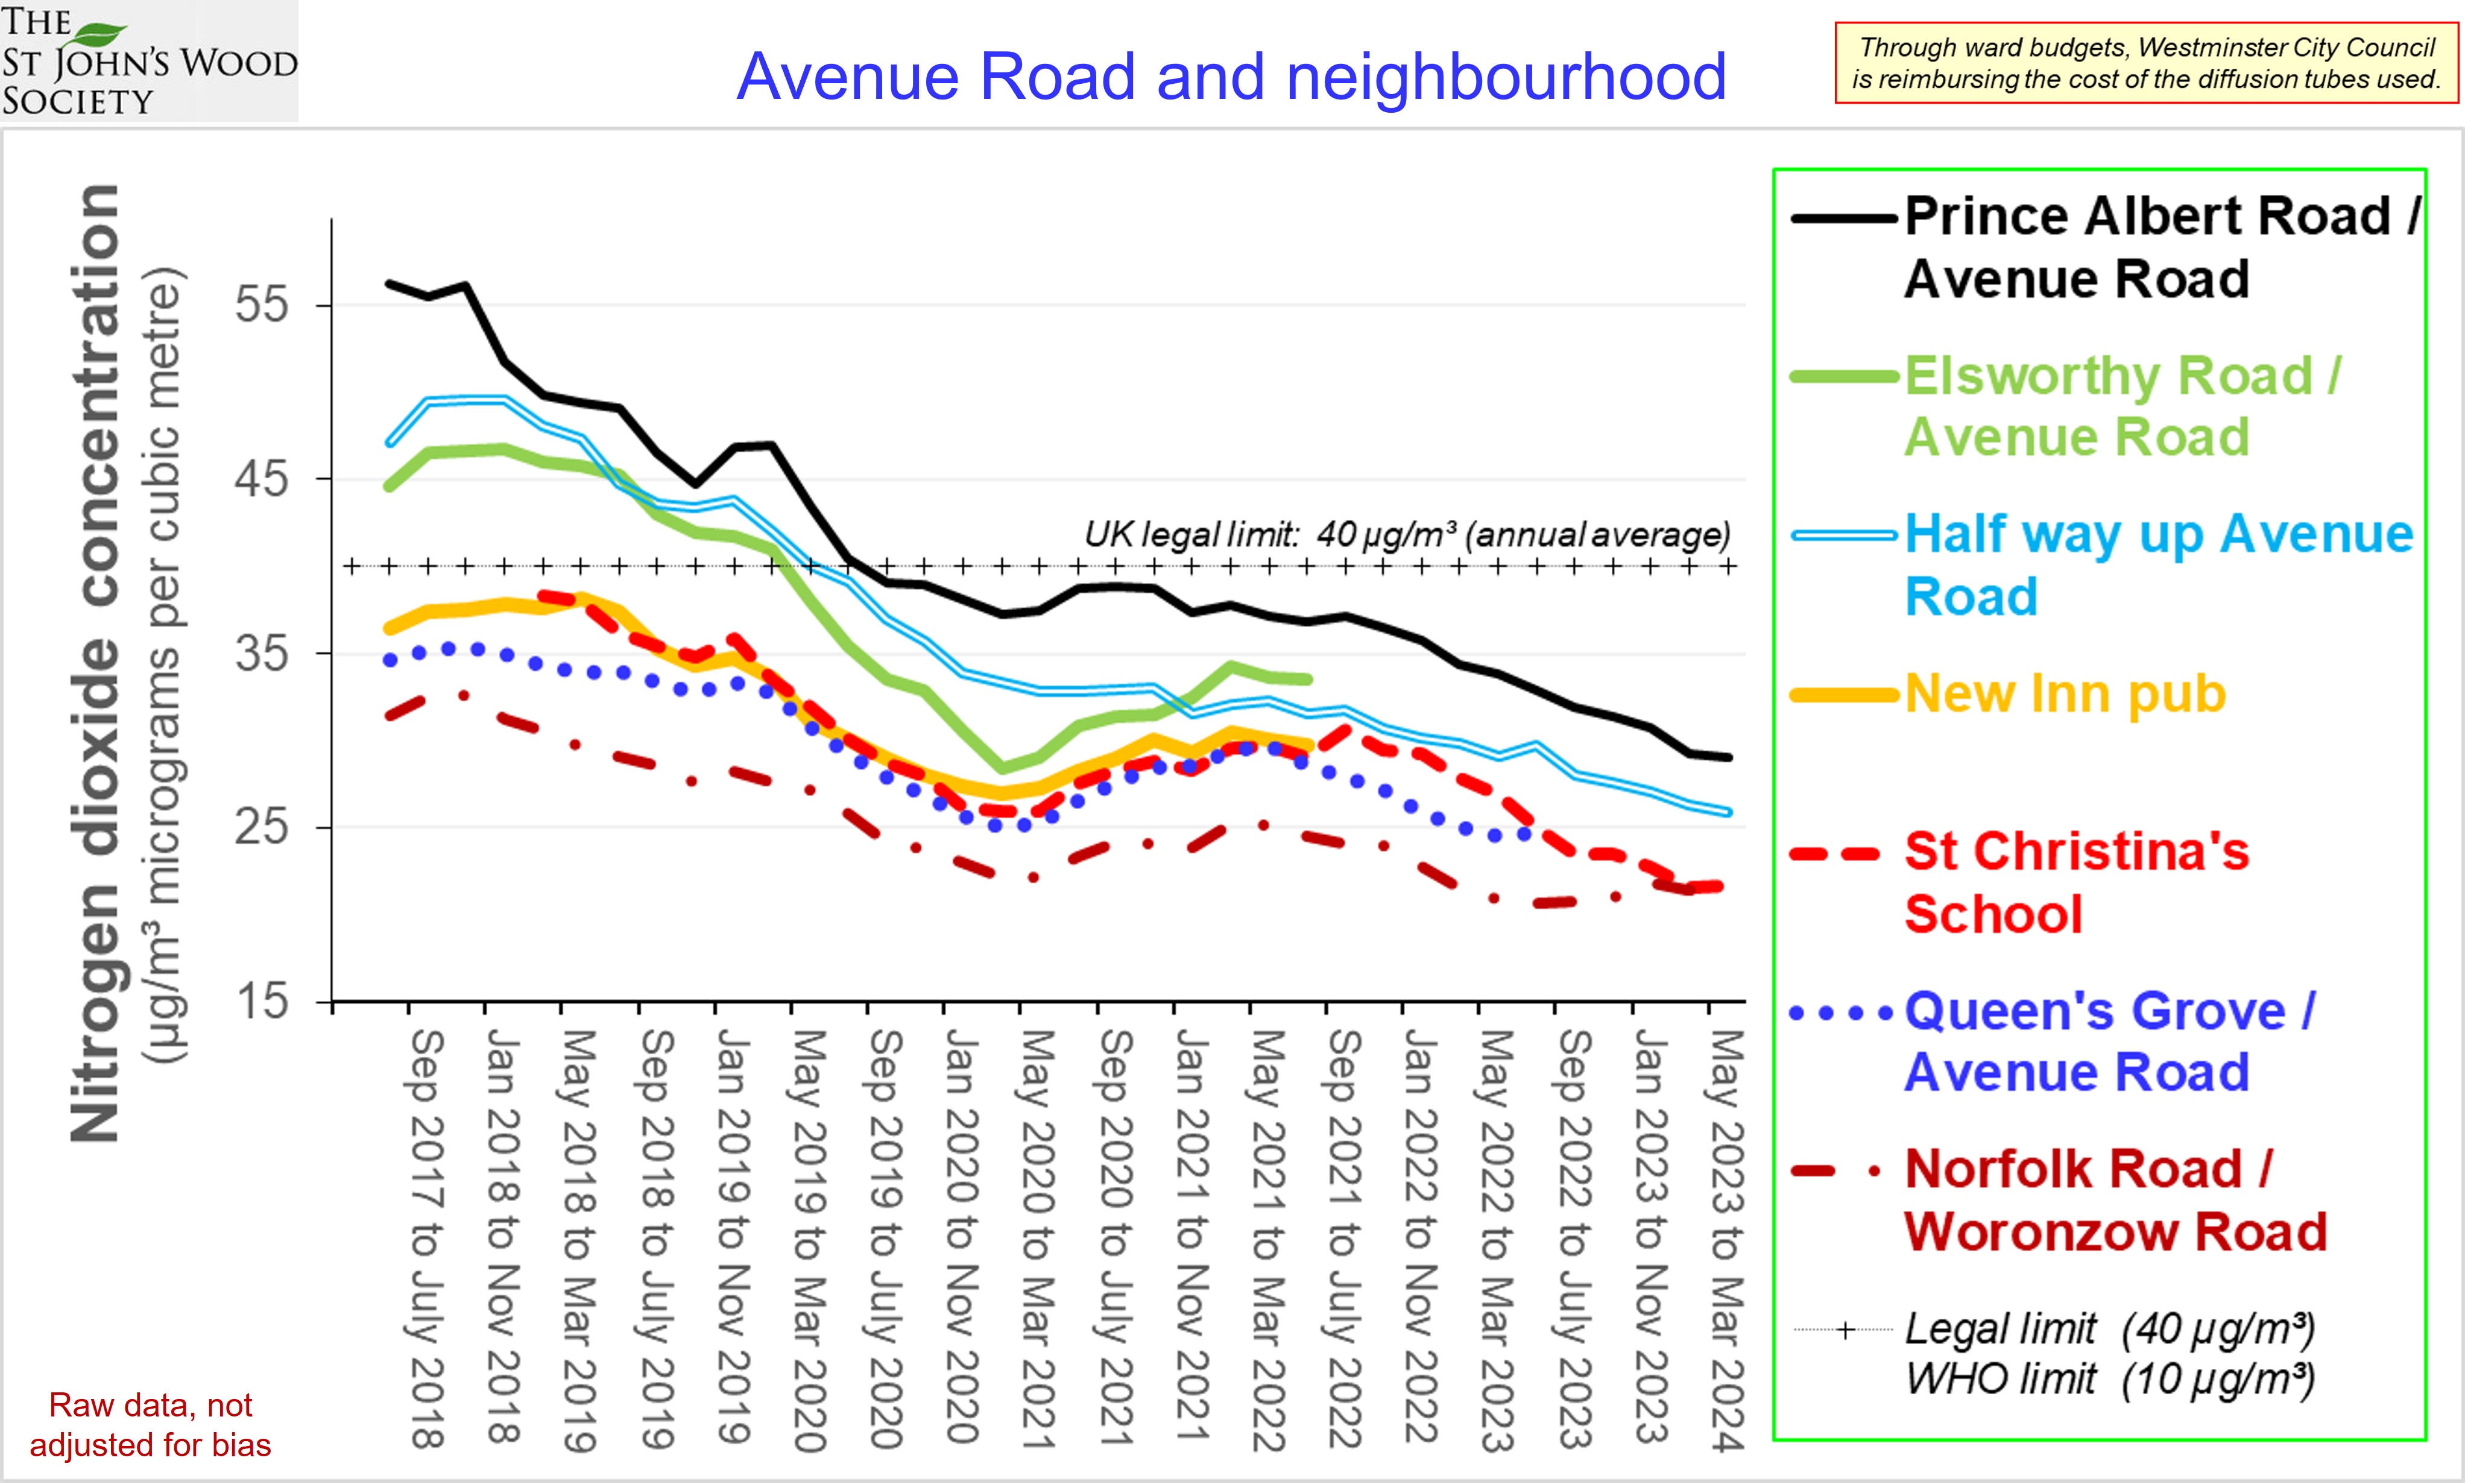
Trends in annual averages |
||||||||||||||
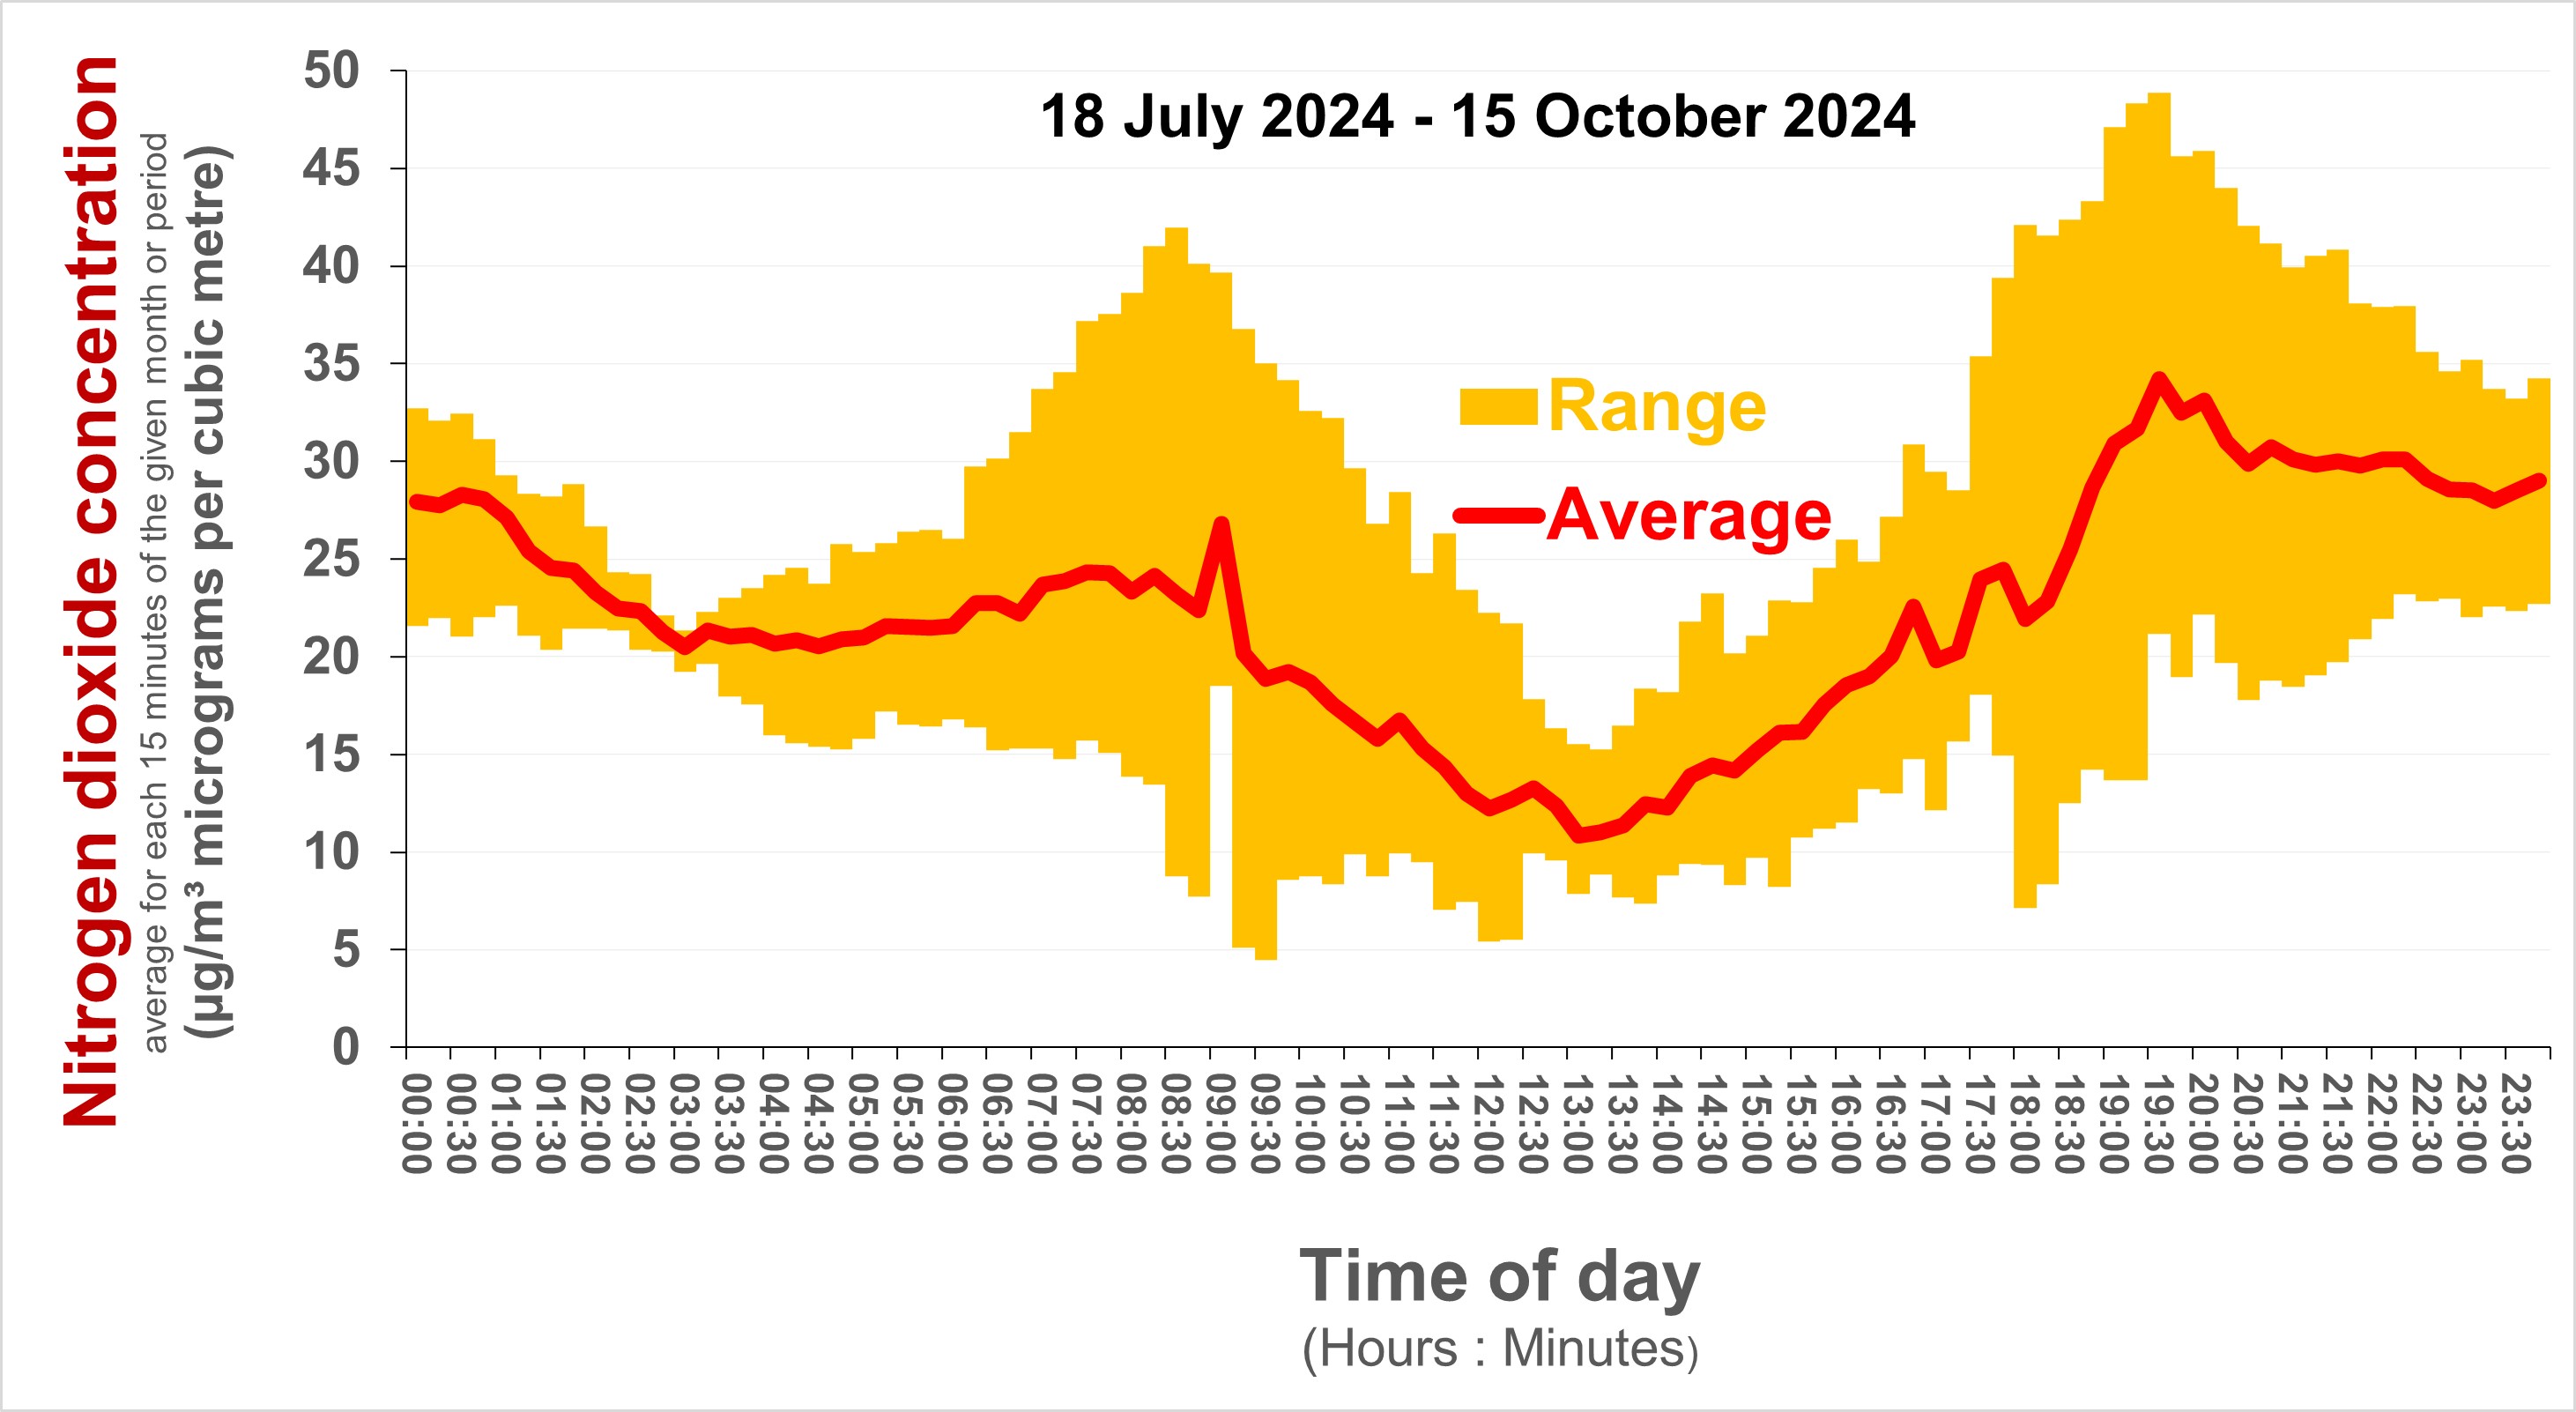
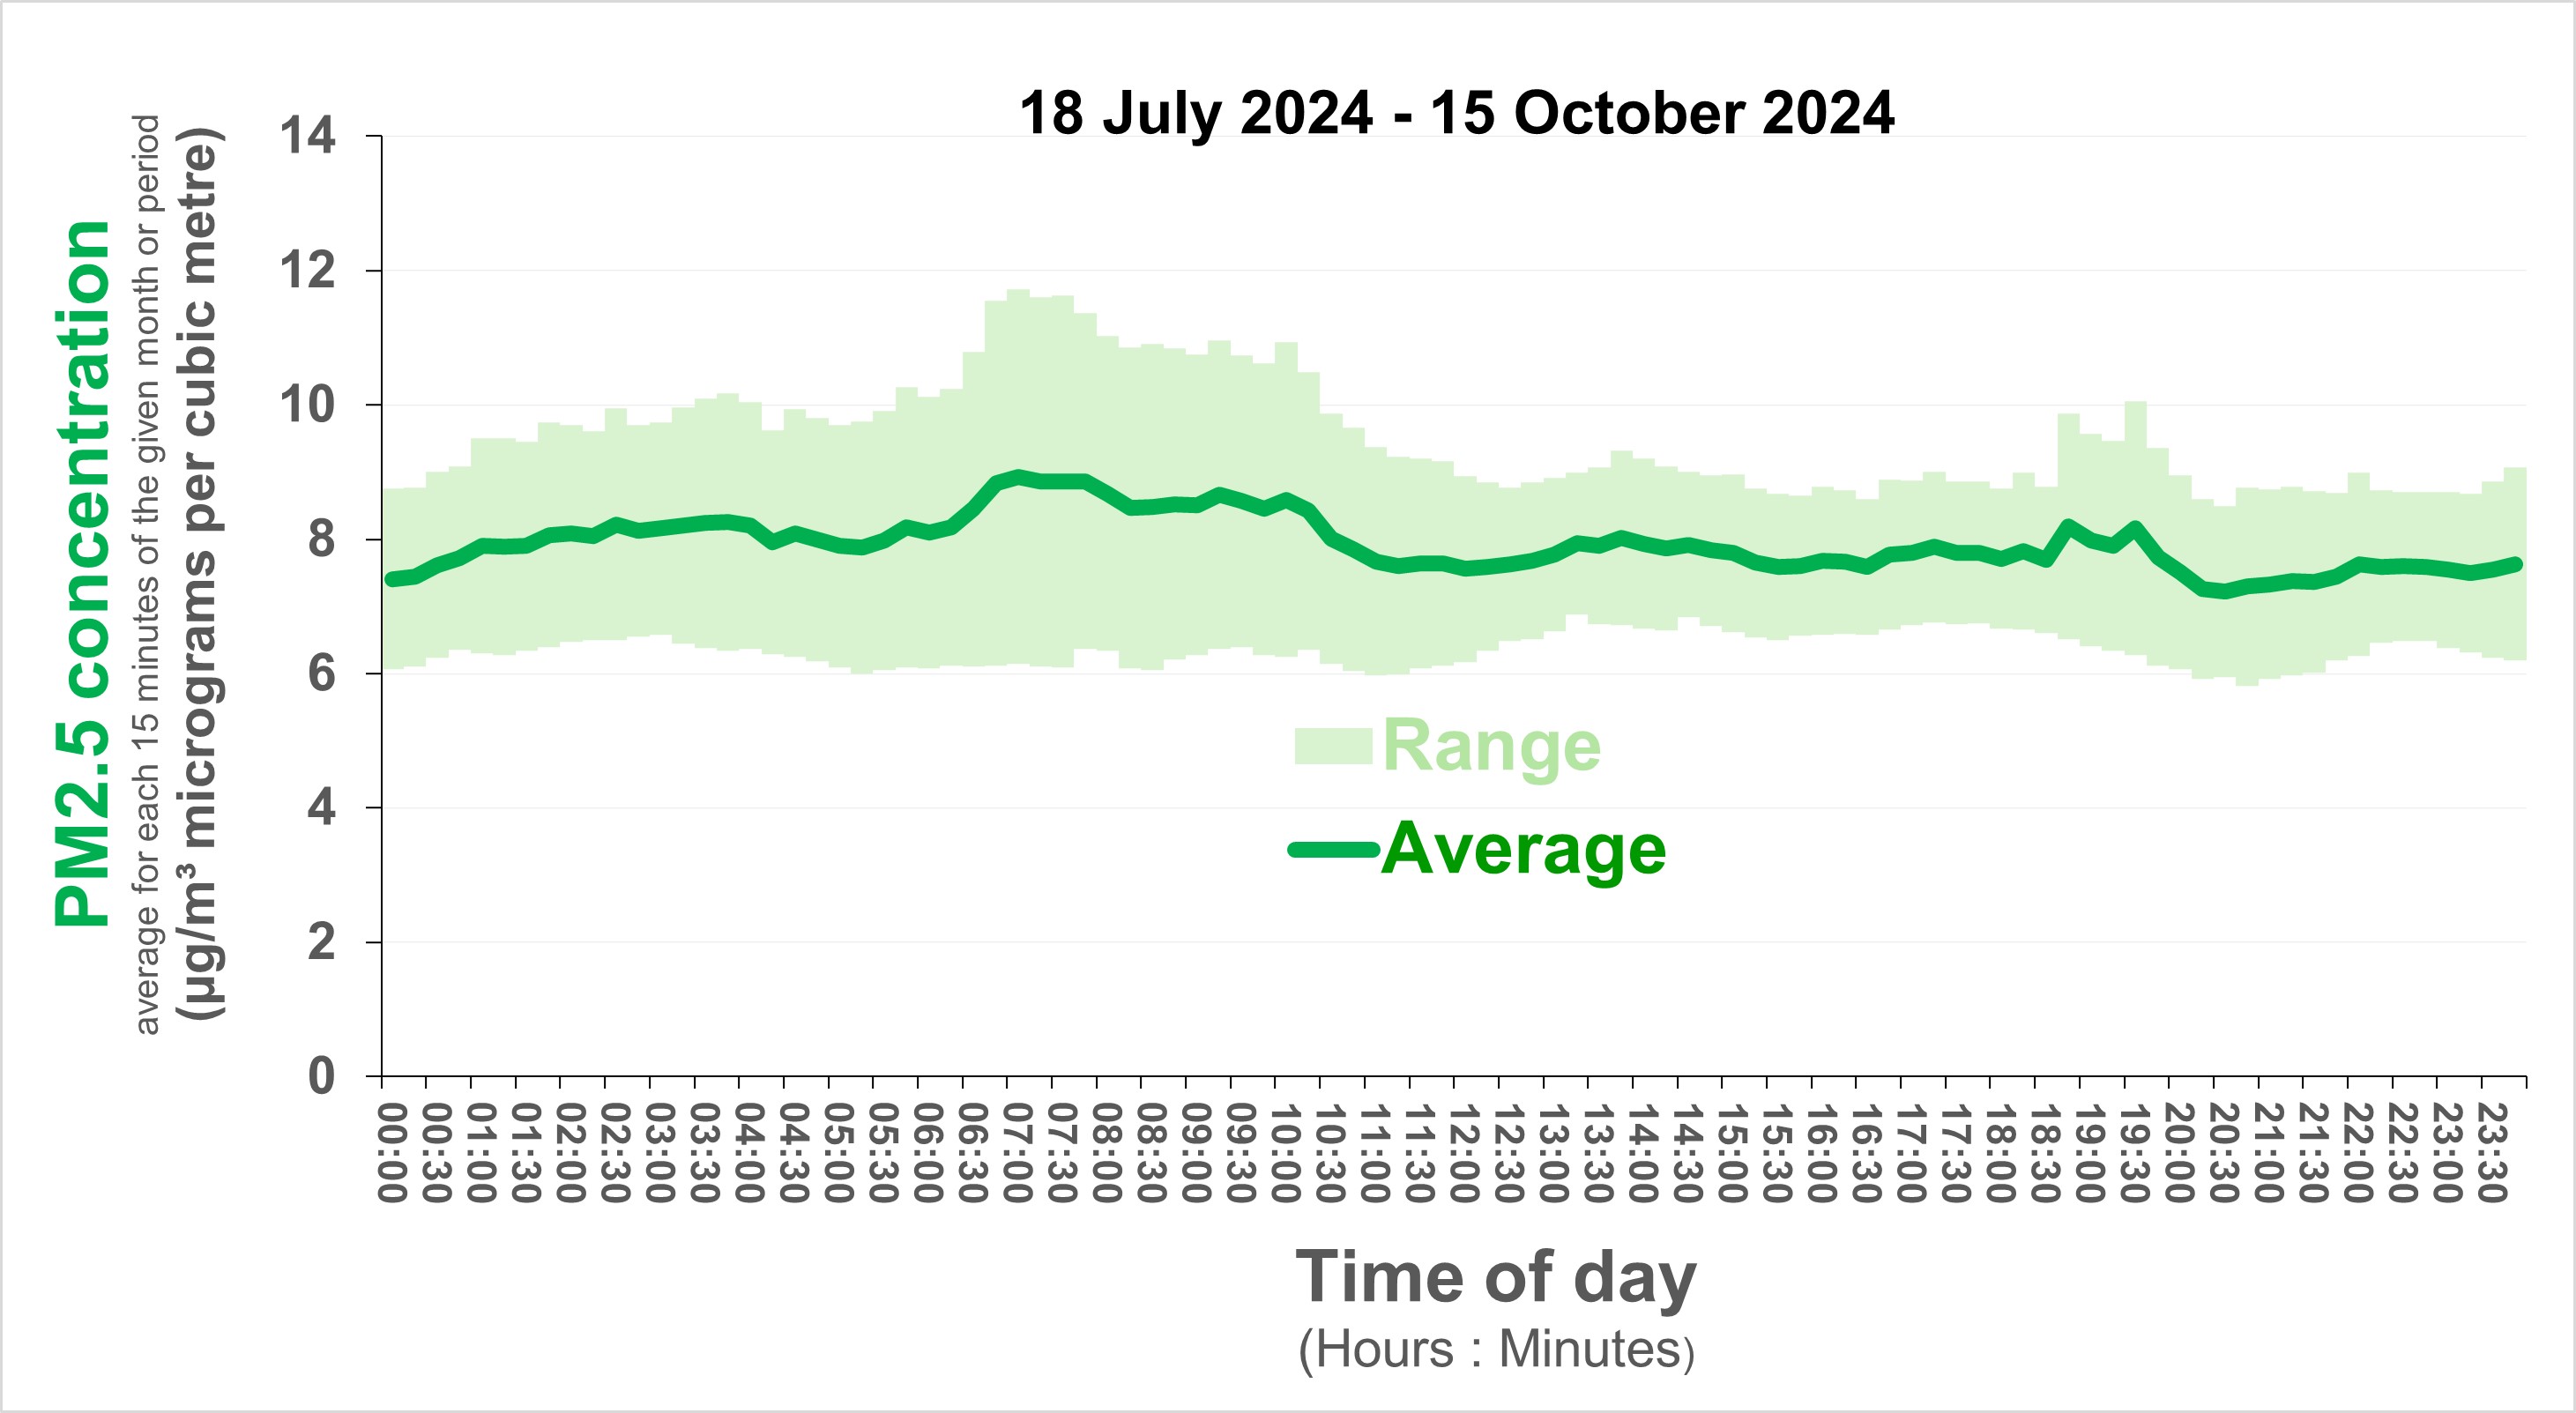
Supplementary charts Indicative average concentrations of NO2 and PM2.5 - and their variation throughout the day (as measured using EarthSense Zephyrs, funded by Westminster City Council)
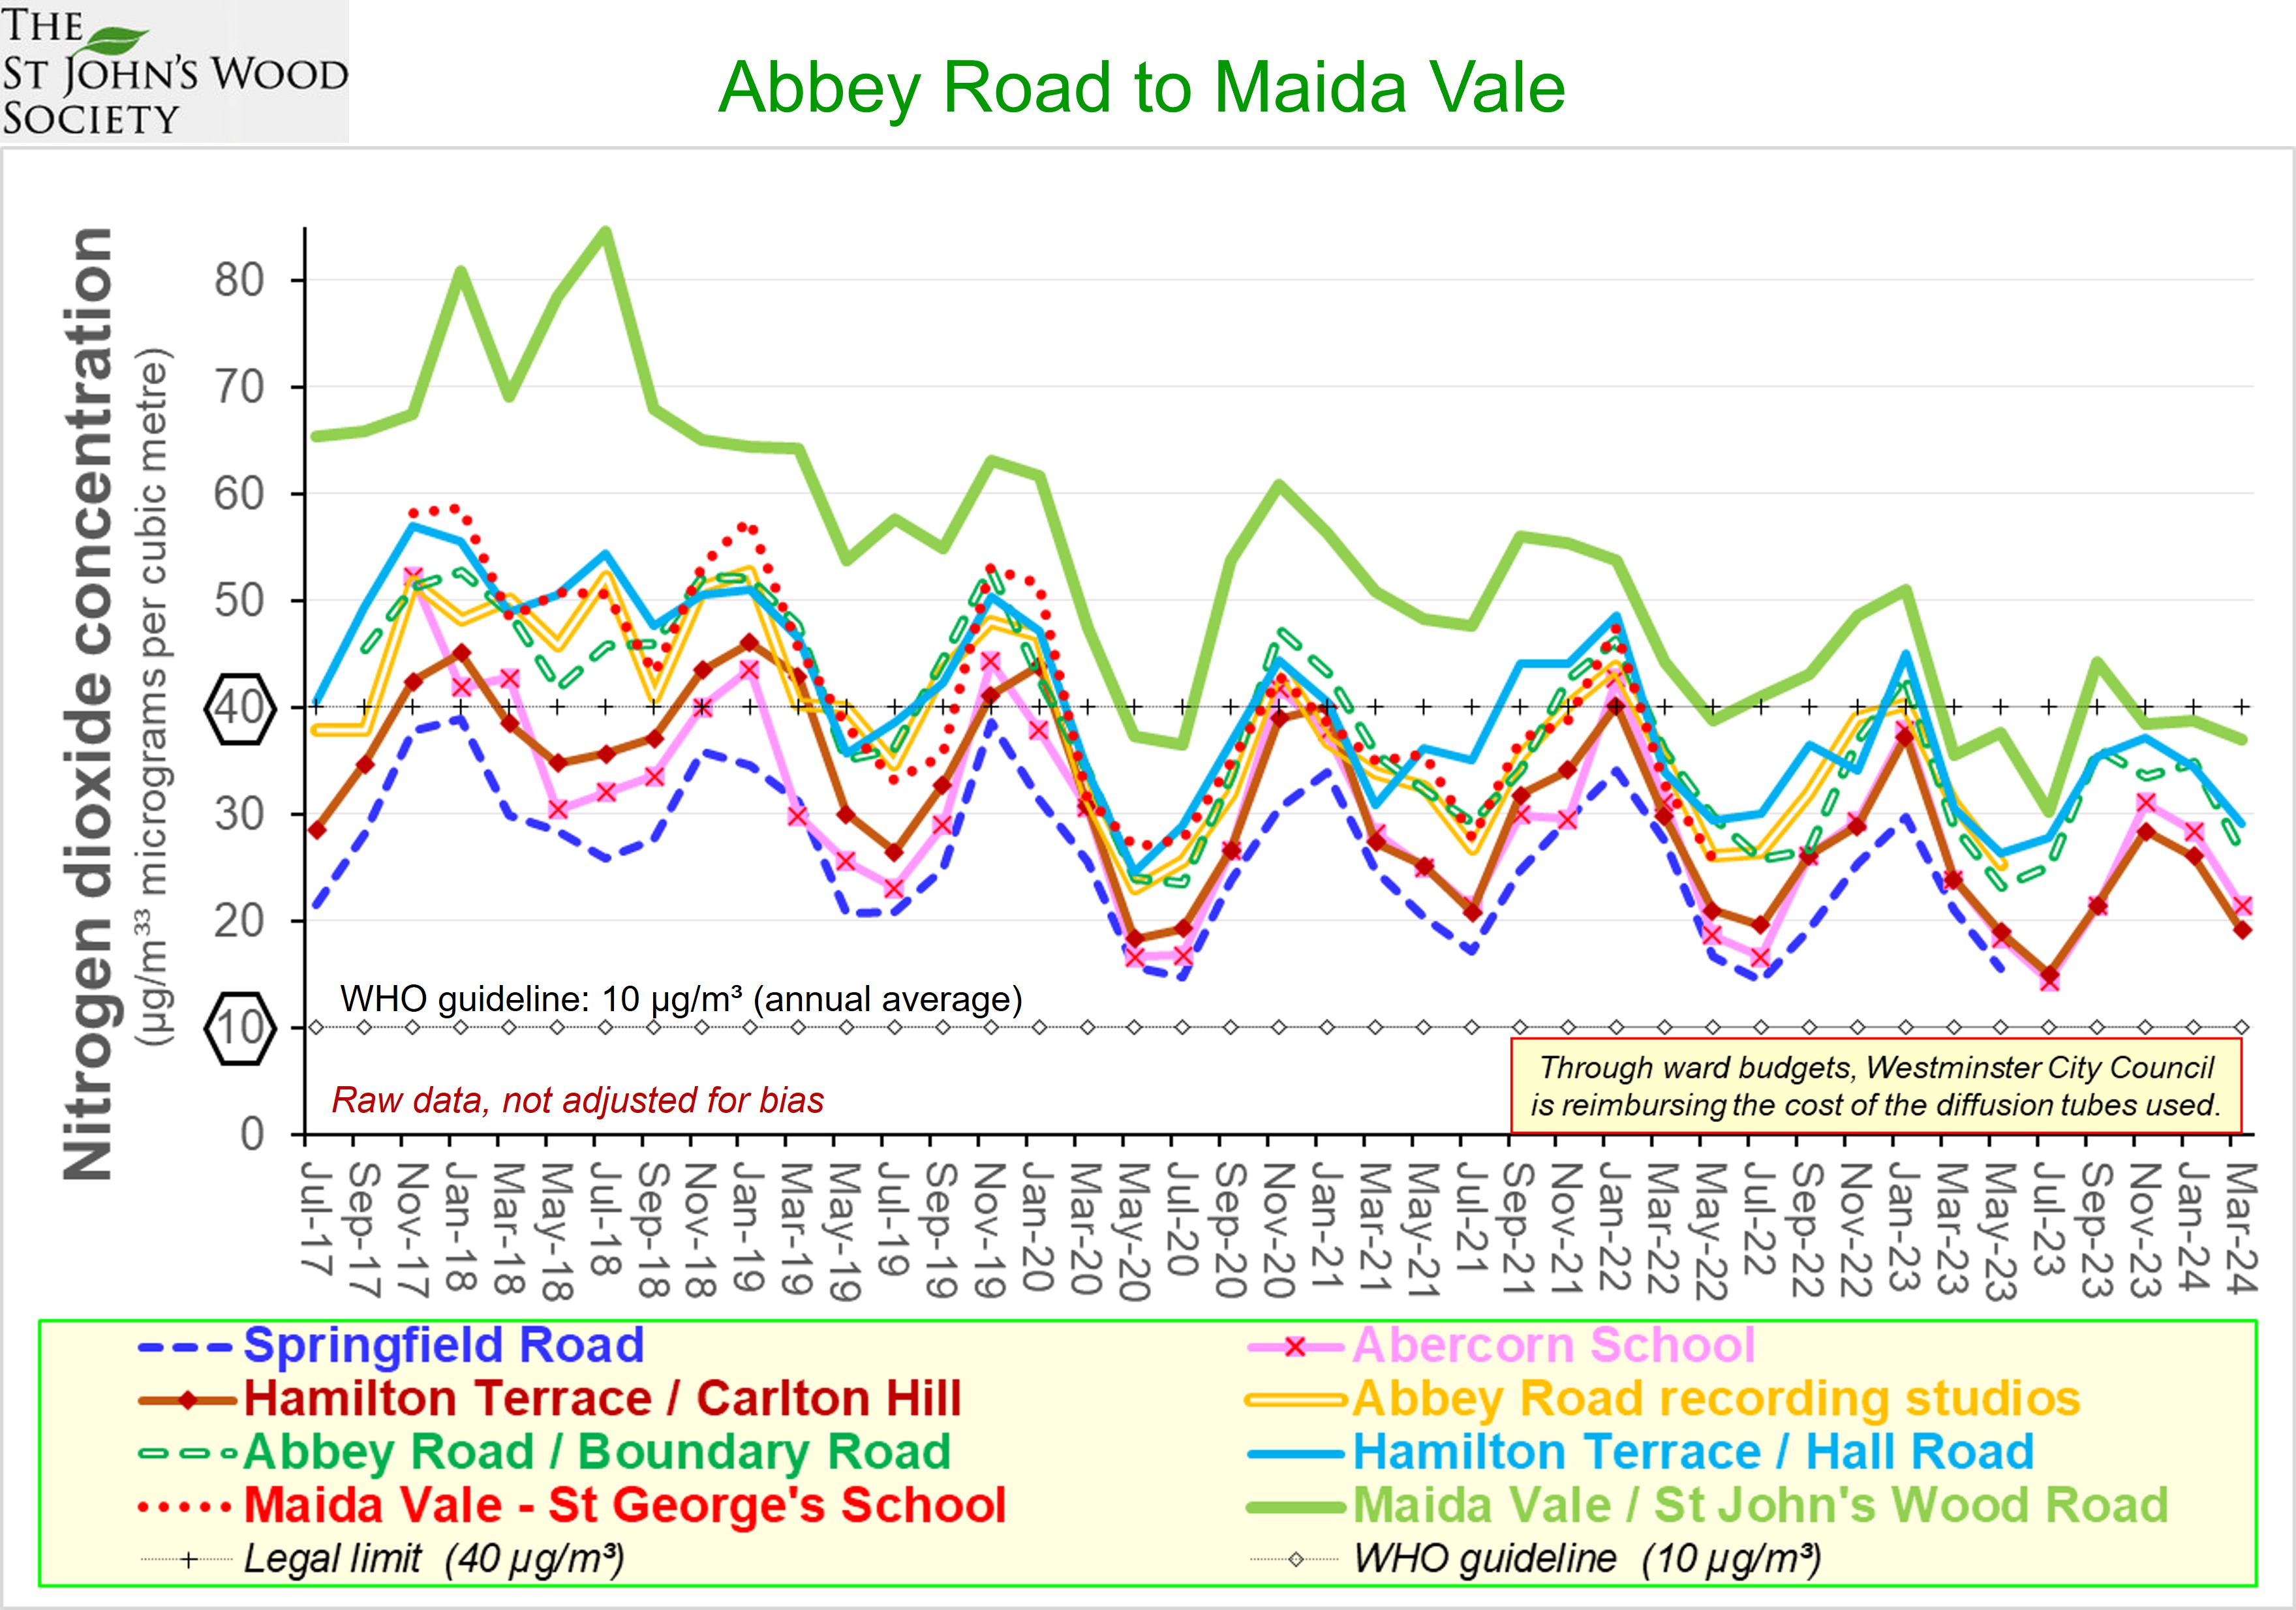
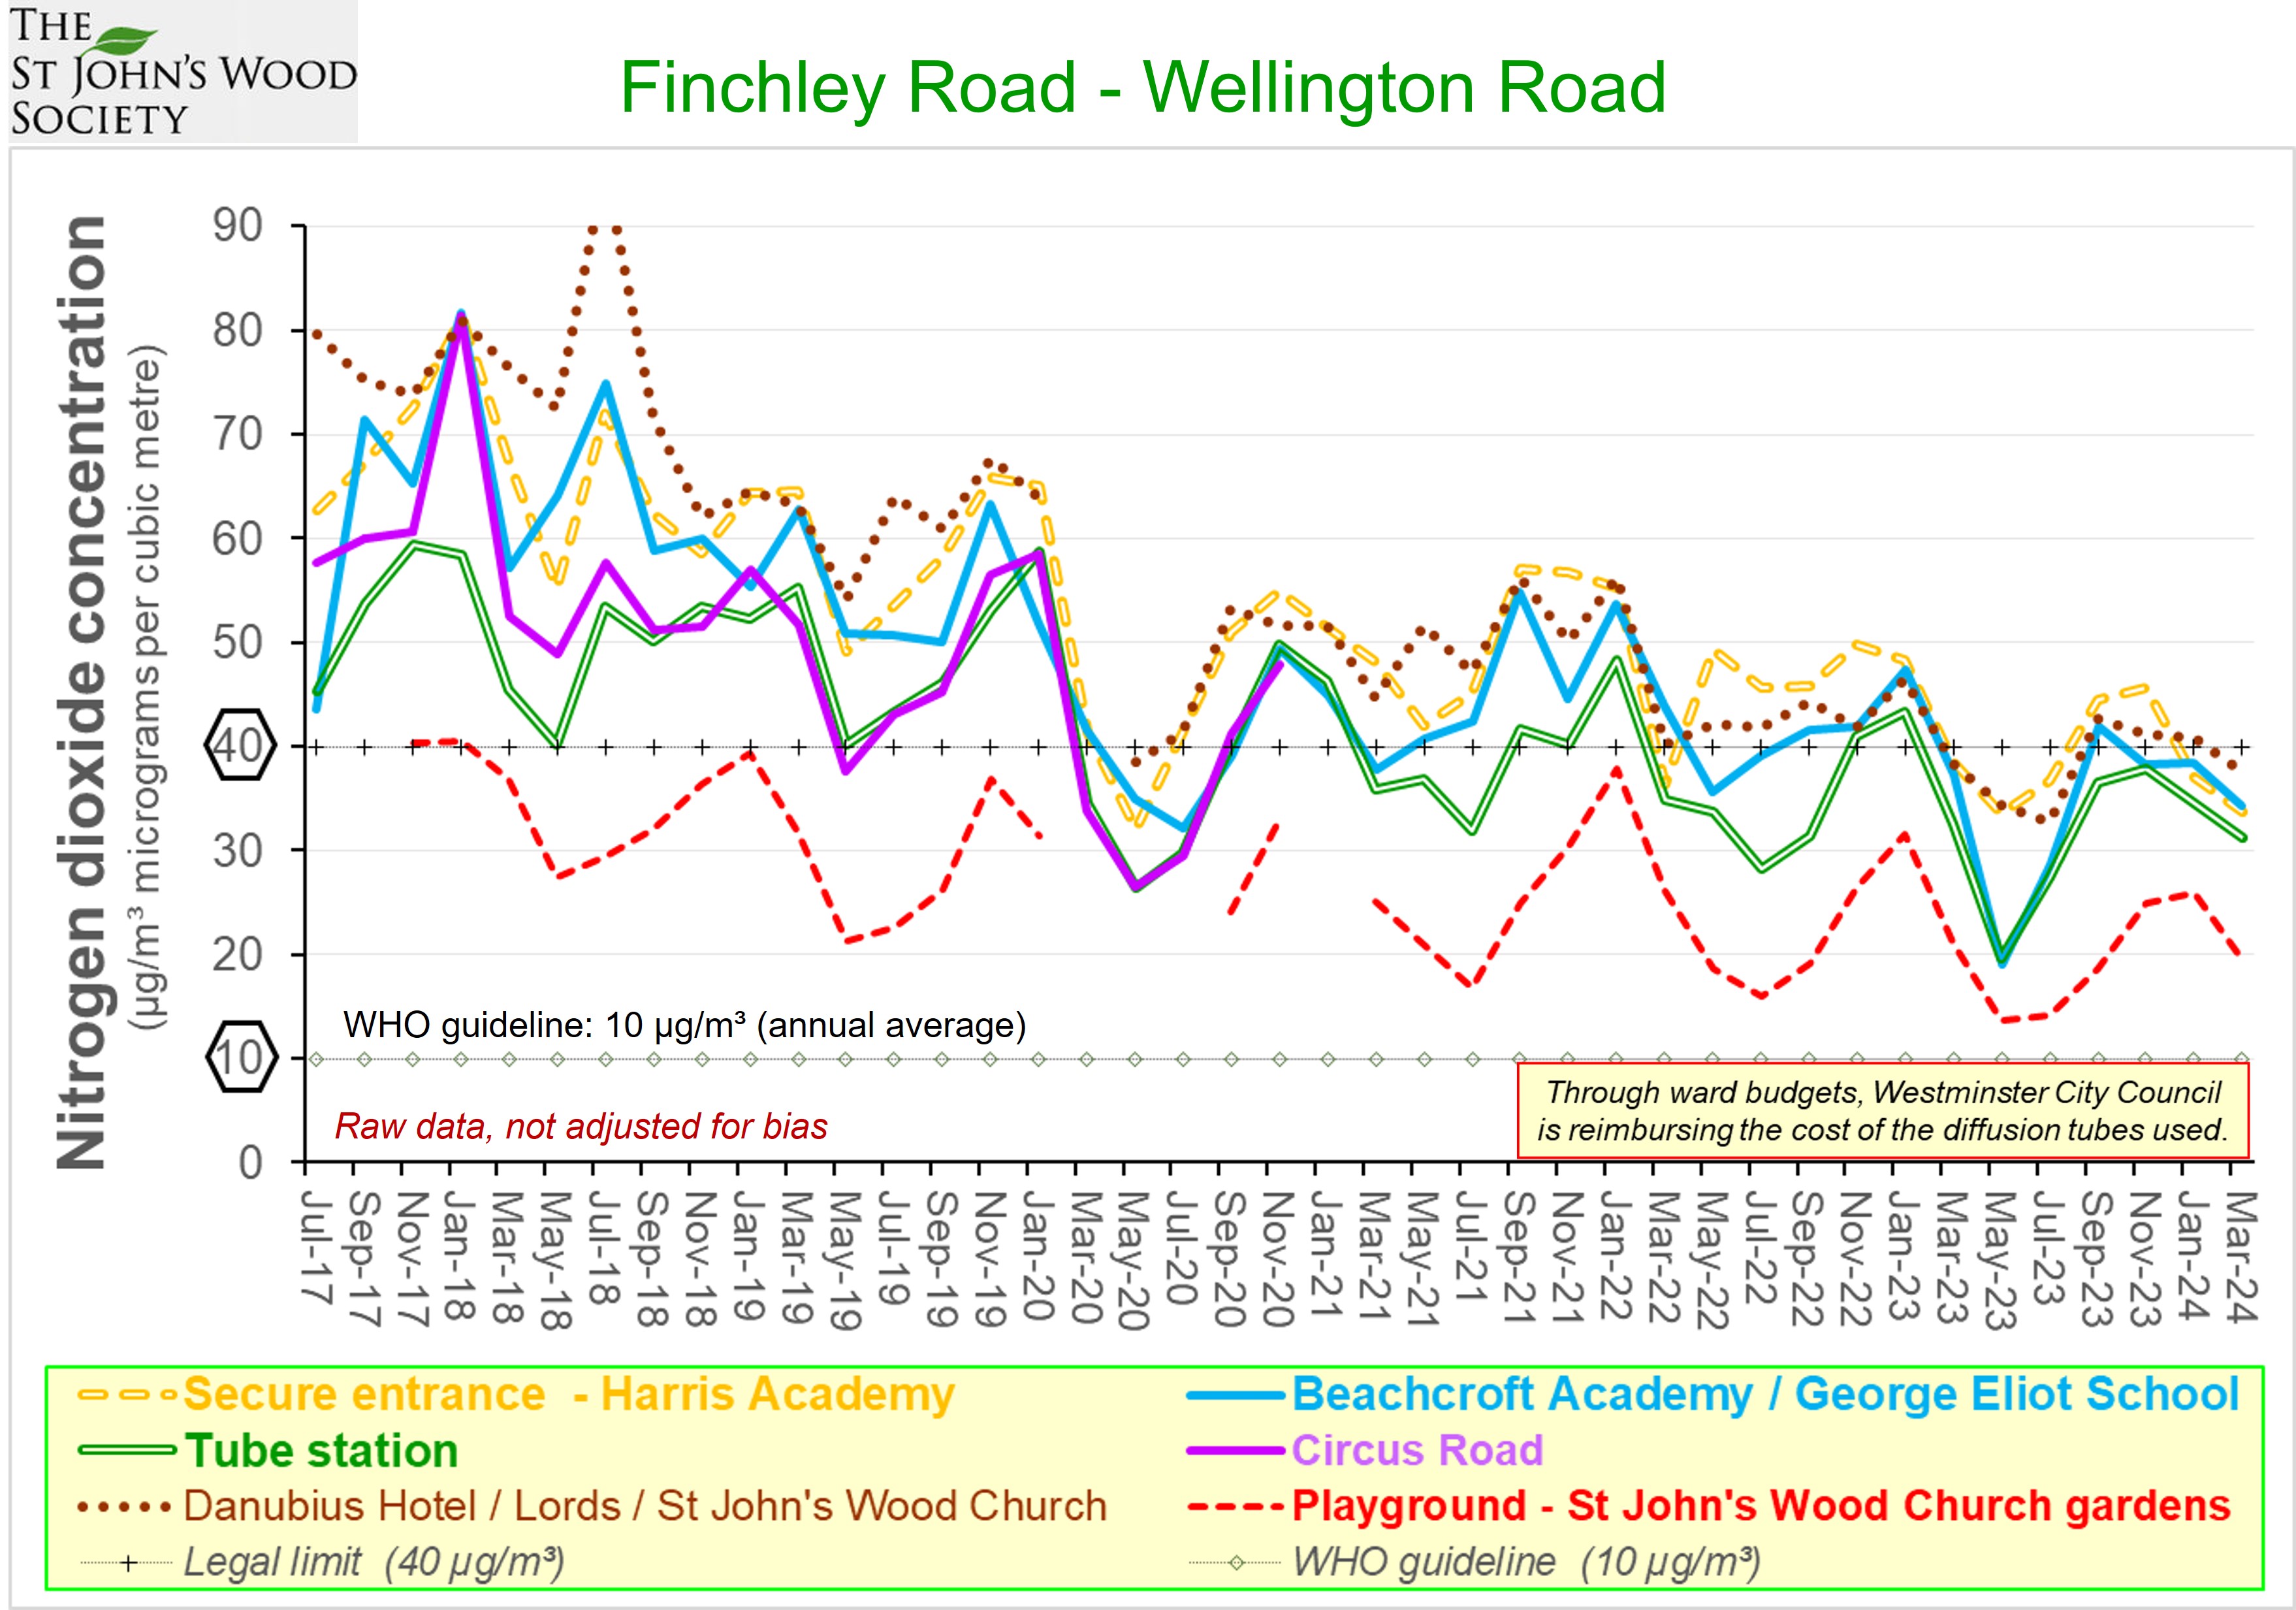
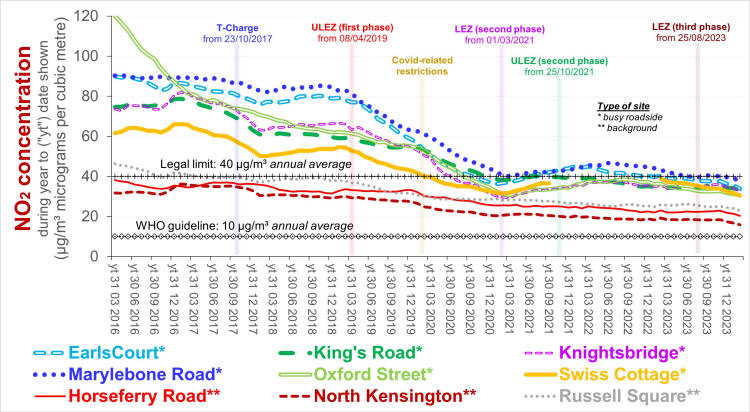 Trends in average NO2 concentrations for successive periods of 12 months Source: Air Quality England (or London Air) (* busy roadside, ** quiet, background site) Remarks: Introduction and extension of the Low and Ultra Low emission zones explains much of the reduction in air pollution from NO2 which occured during periods of a year or so either side of official covid-related constraints. The rate of improvement since then has been slow, implying that further intervention is required - the current UK limit 40 µg/m³ is four times greater than the World Health Organisation guideline. 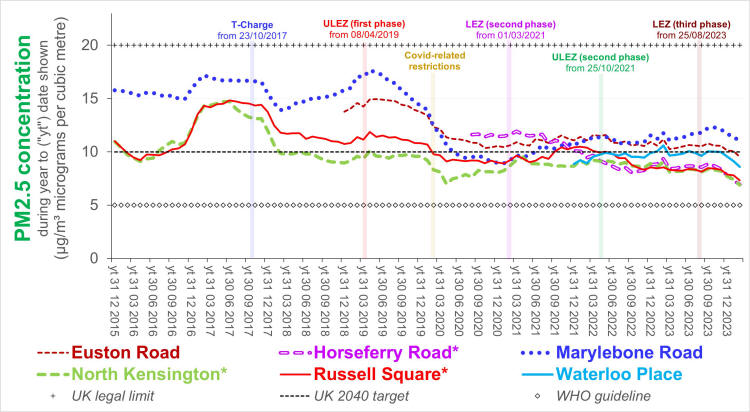 Trends in average PM2.5 concentrations for successive periods of 12 months Source: Air Quality England (or London Air) (* quiet, background site) Remarks: Declining concentration of PM2.5 prior to 2023 are at least partly attributable to Low and Ultra Low Emissions Zones prior to and since covid lockdowns. The dip between 2023 and 2024 and the subsequent increase may be attributable to fluctuating meteorological conditions (direction & strength of the wind), exacerbated by climate change. Agriculture, constuction and industry - not just in the UK - contribute to PM2.5 concentrations in London. Concentrations at Oxford Street and Covent Gardens are amongst the greatest in London, for reasons which have yet to be estabished. 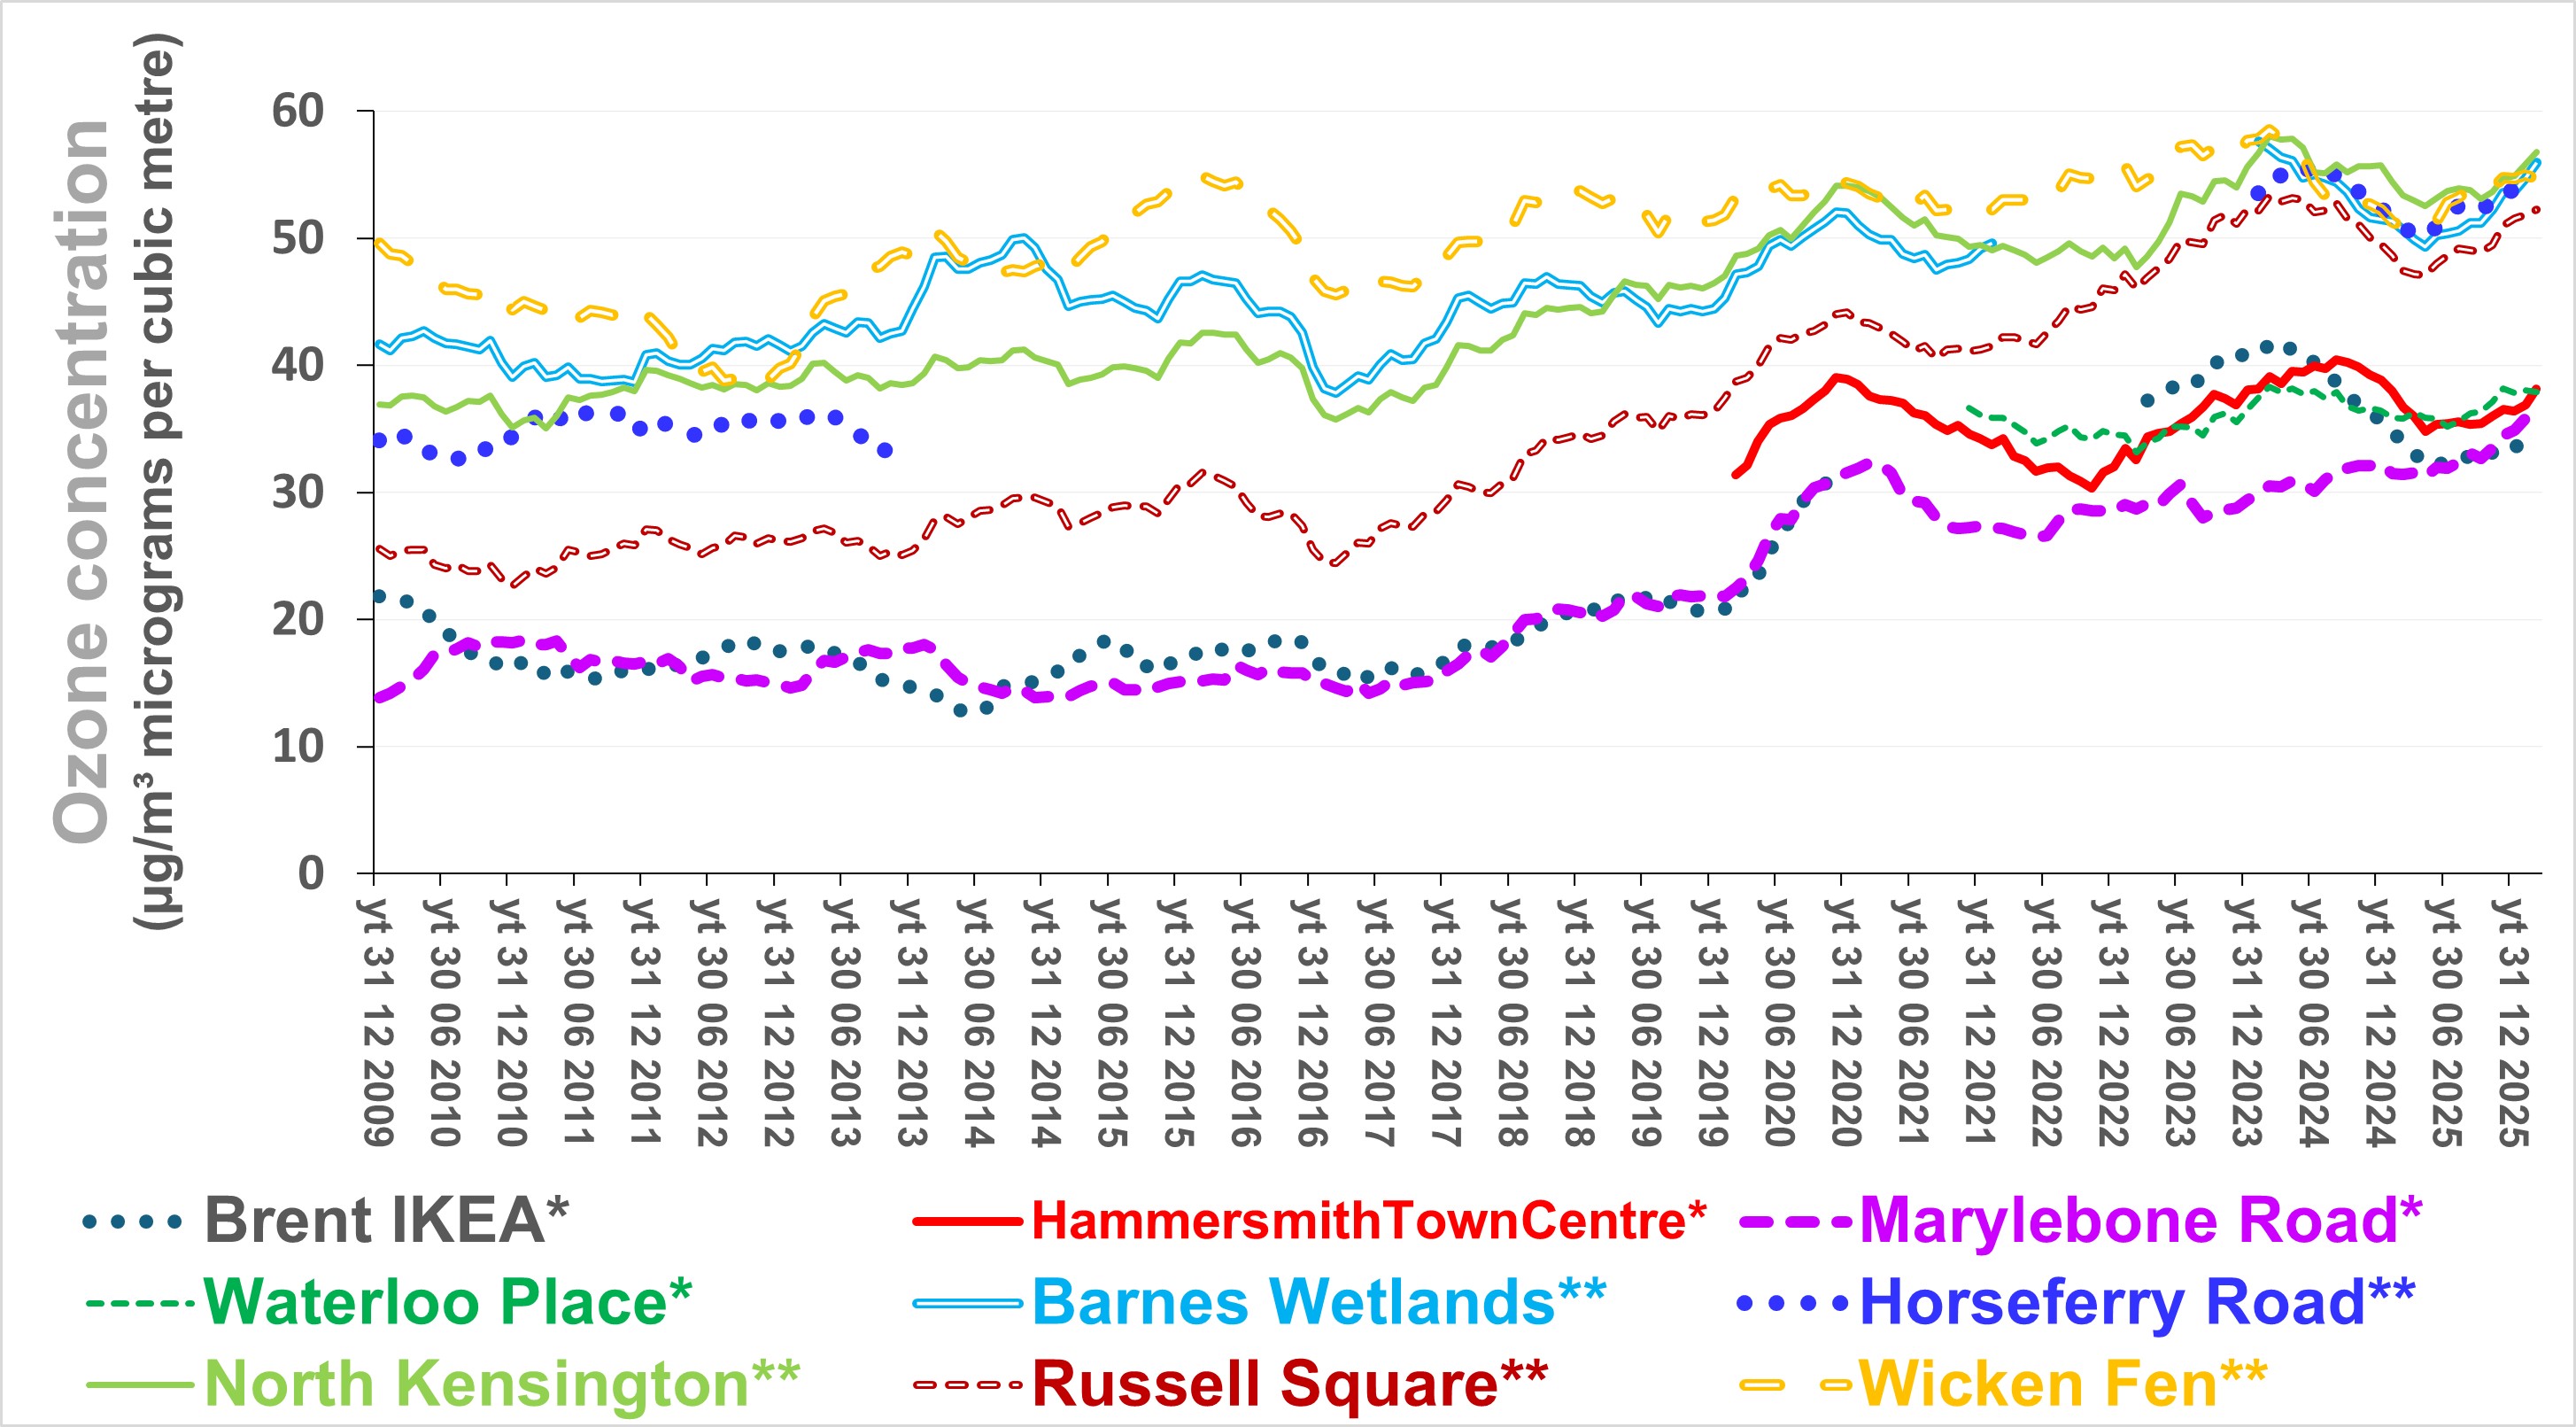 Trends in average ozone concentrations for successive periods of 12 months Source: Air Quality England (or London Air) (* busy roadside, ** quiet, background site) [data ratified to end Q1 2026] Remarks: ozone concentrations have tended to increase since 2017 - and were bunched together during the last couple of years, depending on whether the locations are busy roadside sites or quiet background sites. Data for Wicken Fen (Cambridgeshire) is included for contrast. 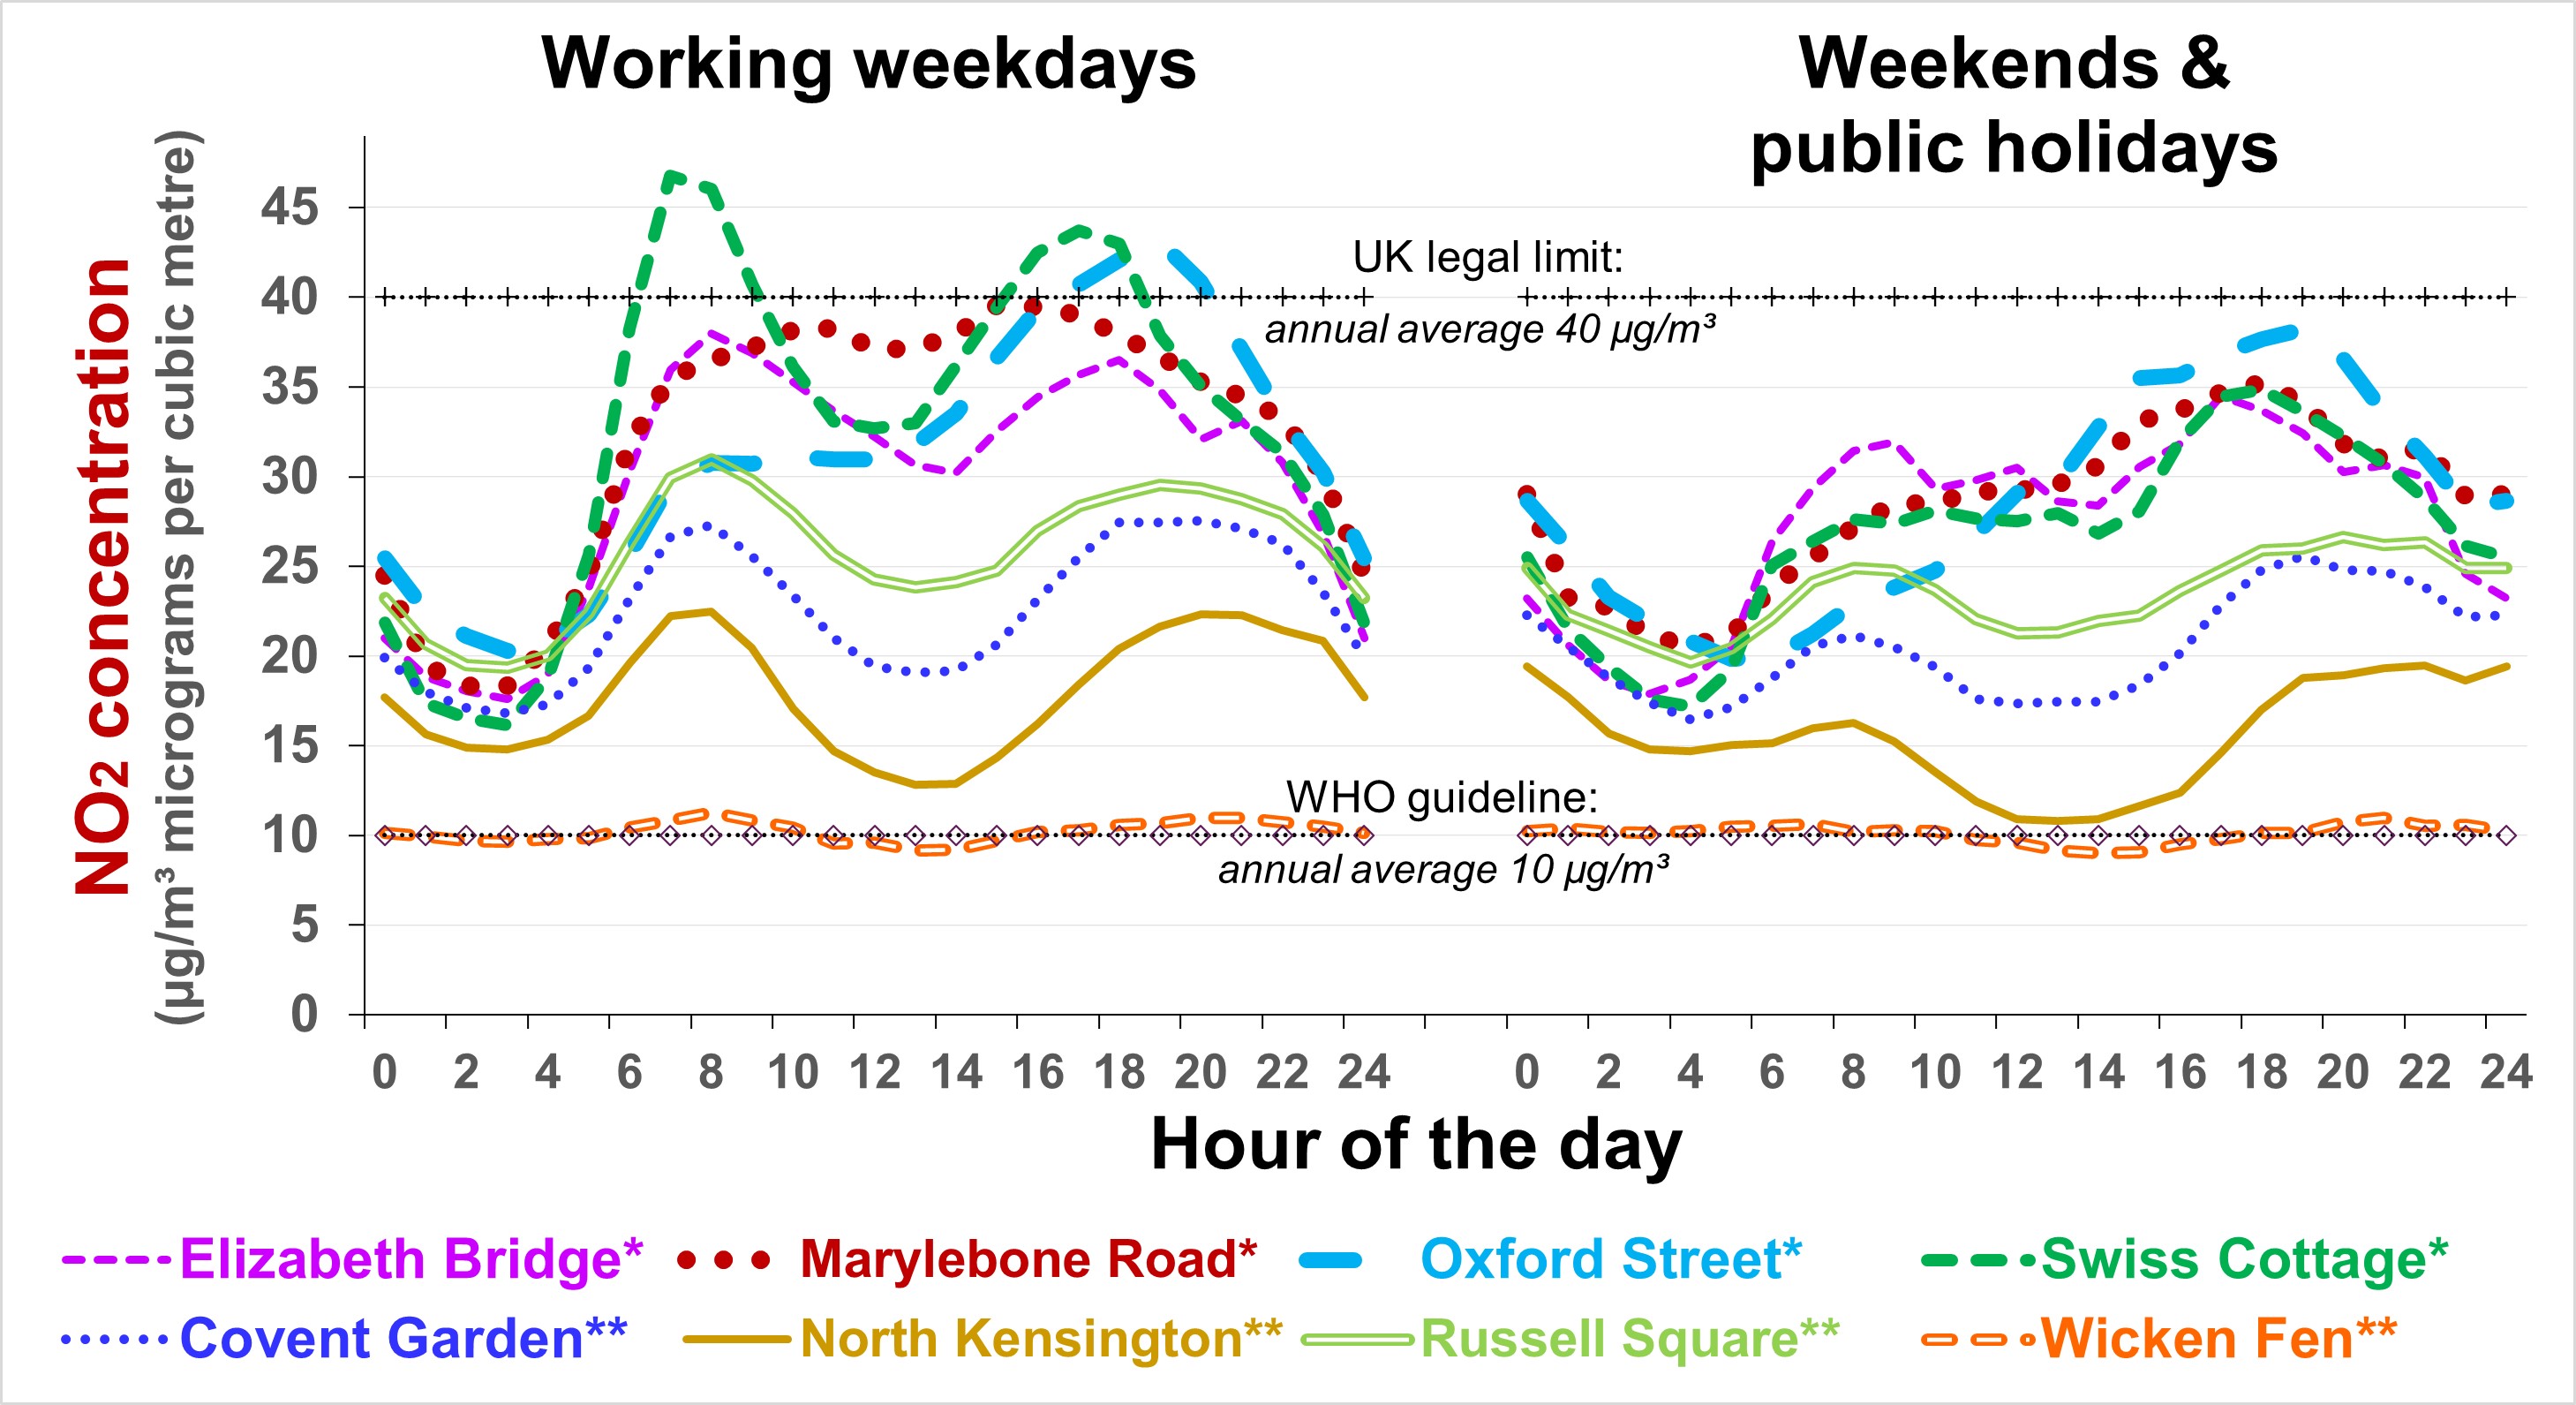 Diurnal variation in average ratified NO2 concentrations - 01/07/2025 to 30/06/2026 Source: Air Quality England (or London Air) (* busy roadside, ** quiet, background site) [data ratified to end Q1 2026] Remarks: Weekday concentrations exceed those on days off, have a more pronounced morning rush hour peak and an earlier evening peak. The lowest concentrations tend to be at lunch time and 3 am. Data for Wicken Fen (Cambridgeshire) is included for contrast.  Diurnal variation in average PM2.5 concentrations - 01/07/2025 to 30/06/2026 Source: Air Quality England (or London Air) (* busy roadside, ** quiet, background site) [data ratified to end Q1 2026] Remarks: Concentrations of PM2.5 tend to vary little not only between the working week and days off, but also with time of day. They exceed the World Health Organisation guideline by a substantial margin. Data for Wicken Fen (Cambridgeshire) is included for contrast. 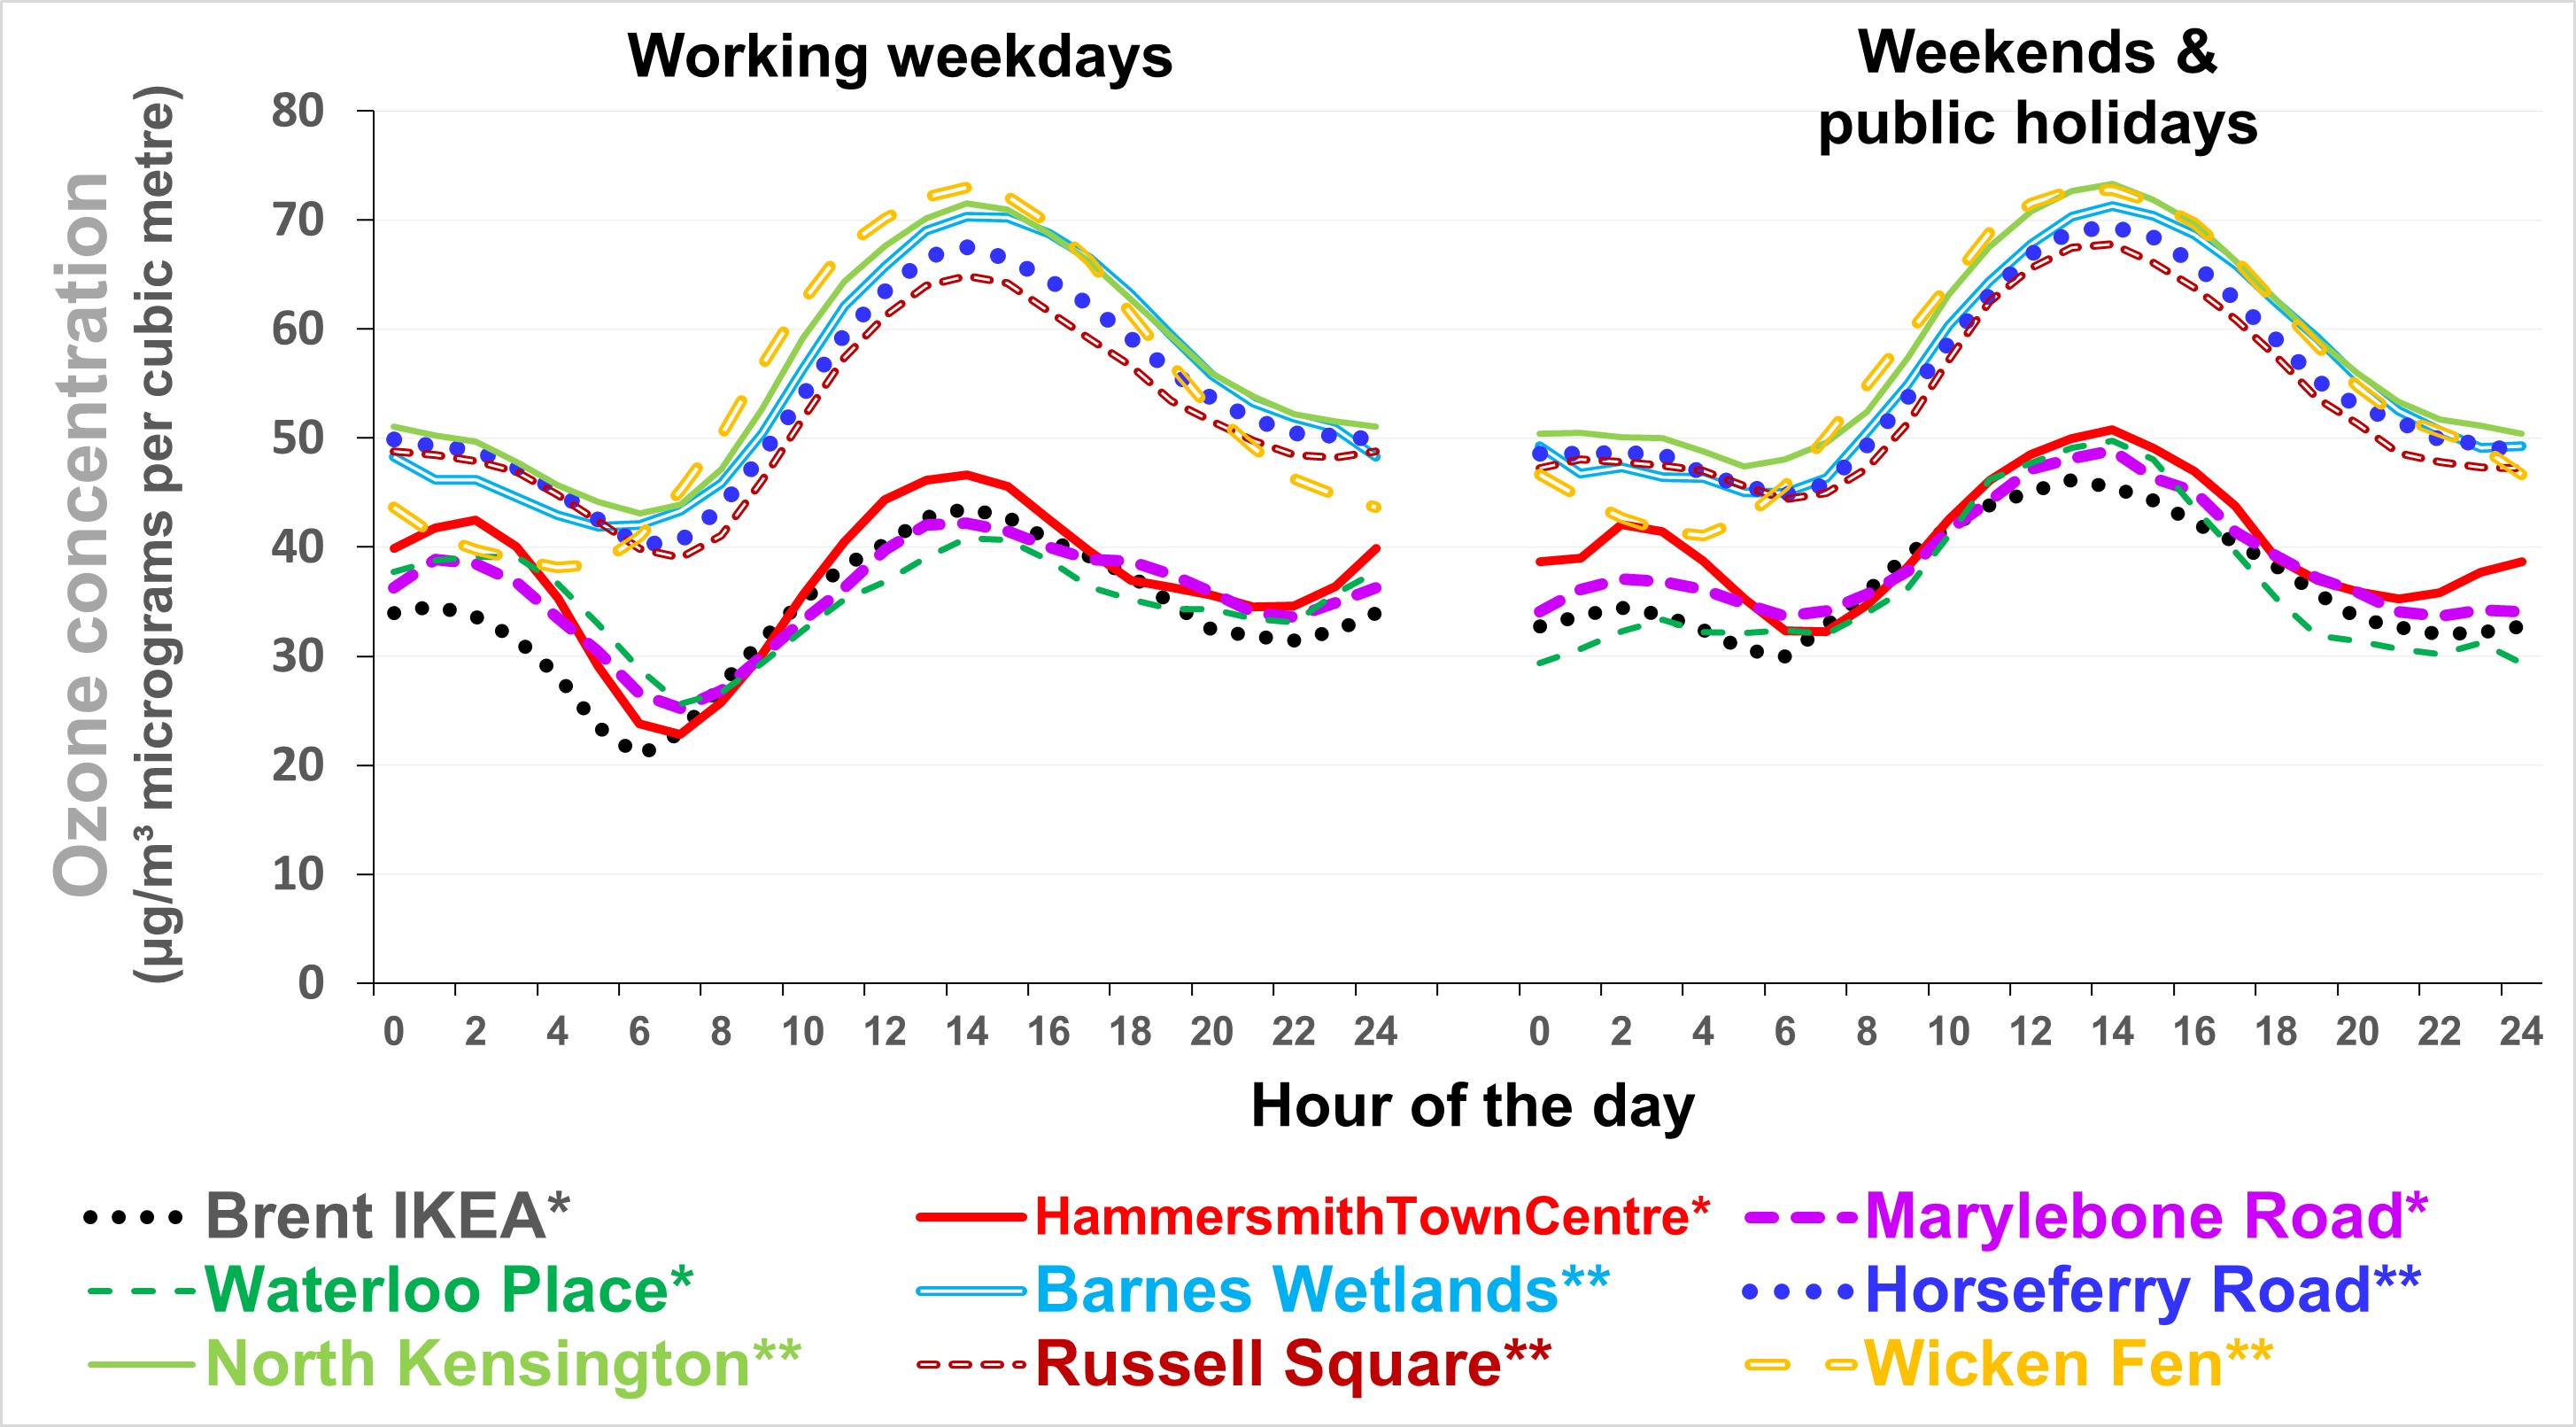 Diurnal variation in average ozone concentrations - 01/07/2025 to 30/06/2026 Source: Air Quality England (or London Air) (* busy roadside, ** quiet, background site) [data ratified to end Q1 2025] Remarks: bunching of ozone concentrations depending on whether the location is a busy roadside or quiet background site. Data for Wicken Fen (Cambridgeshire) is included for contrast. z 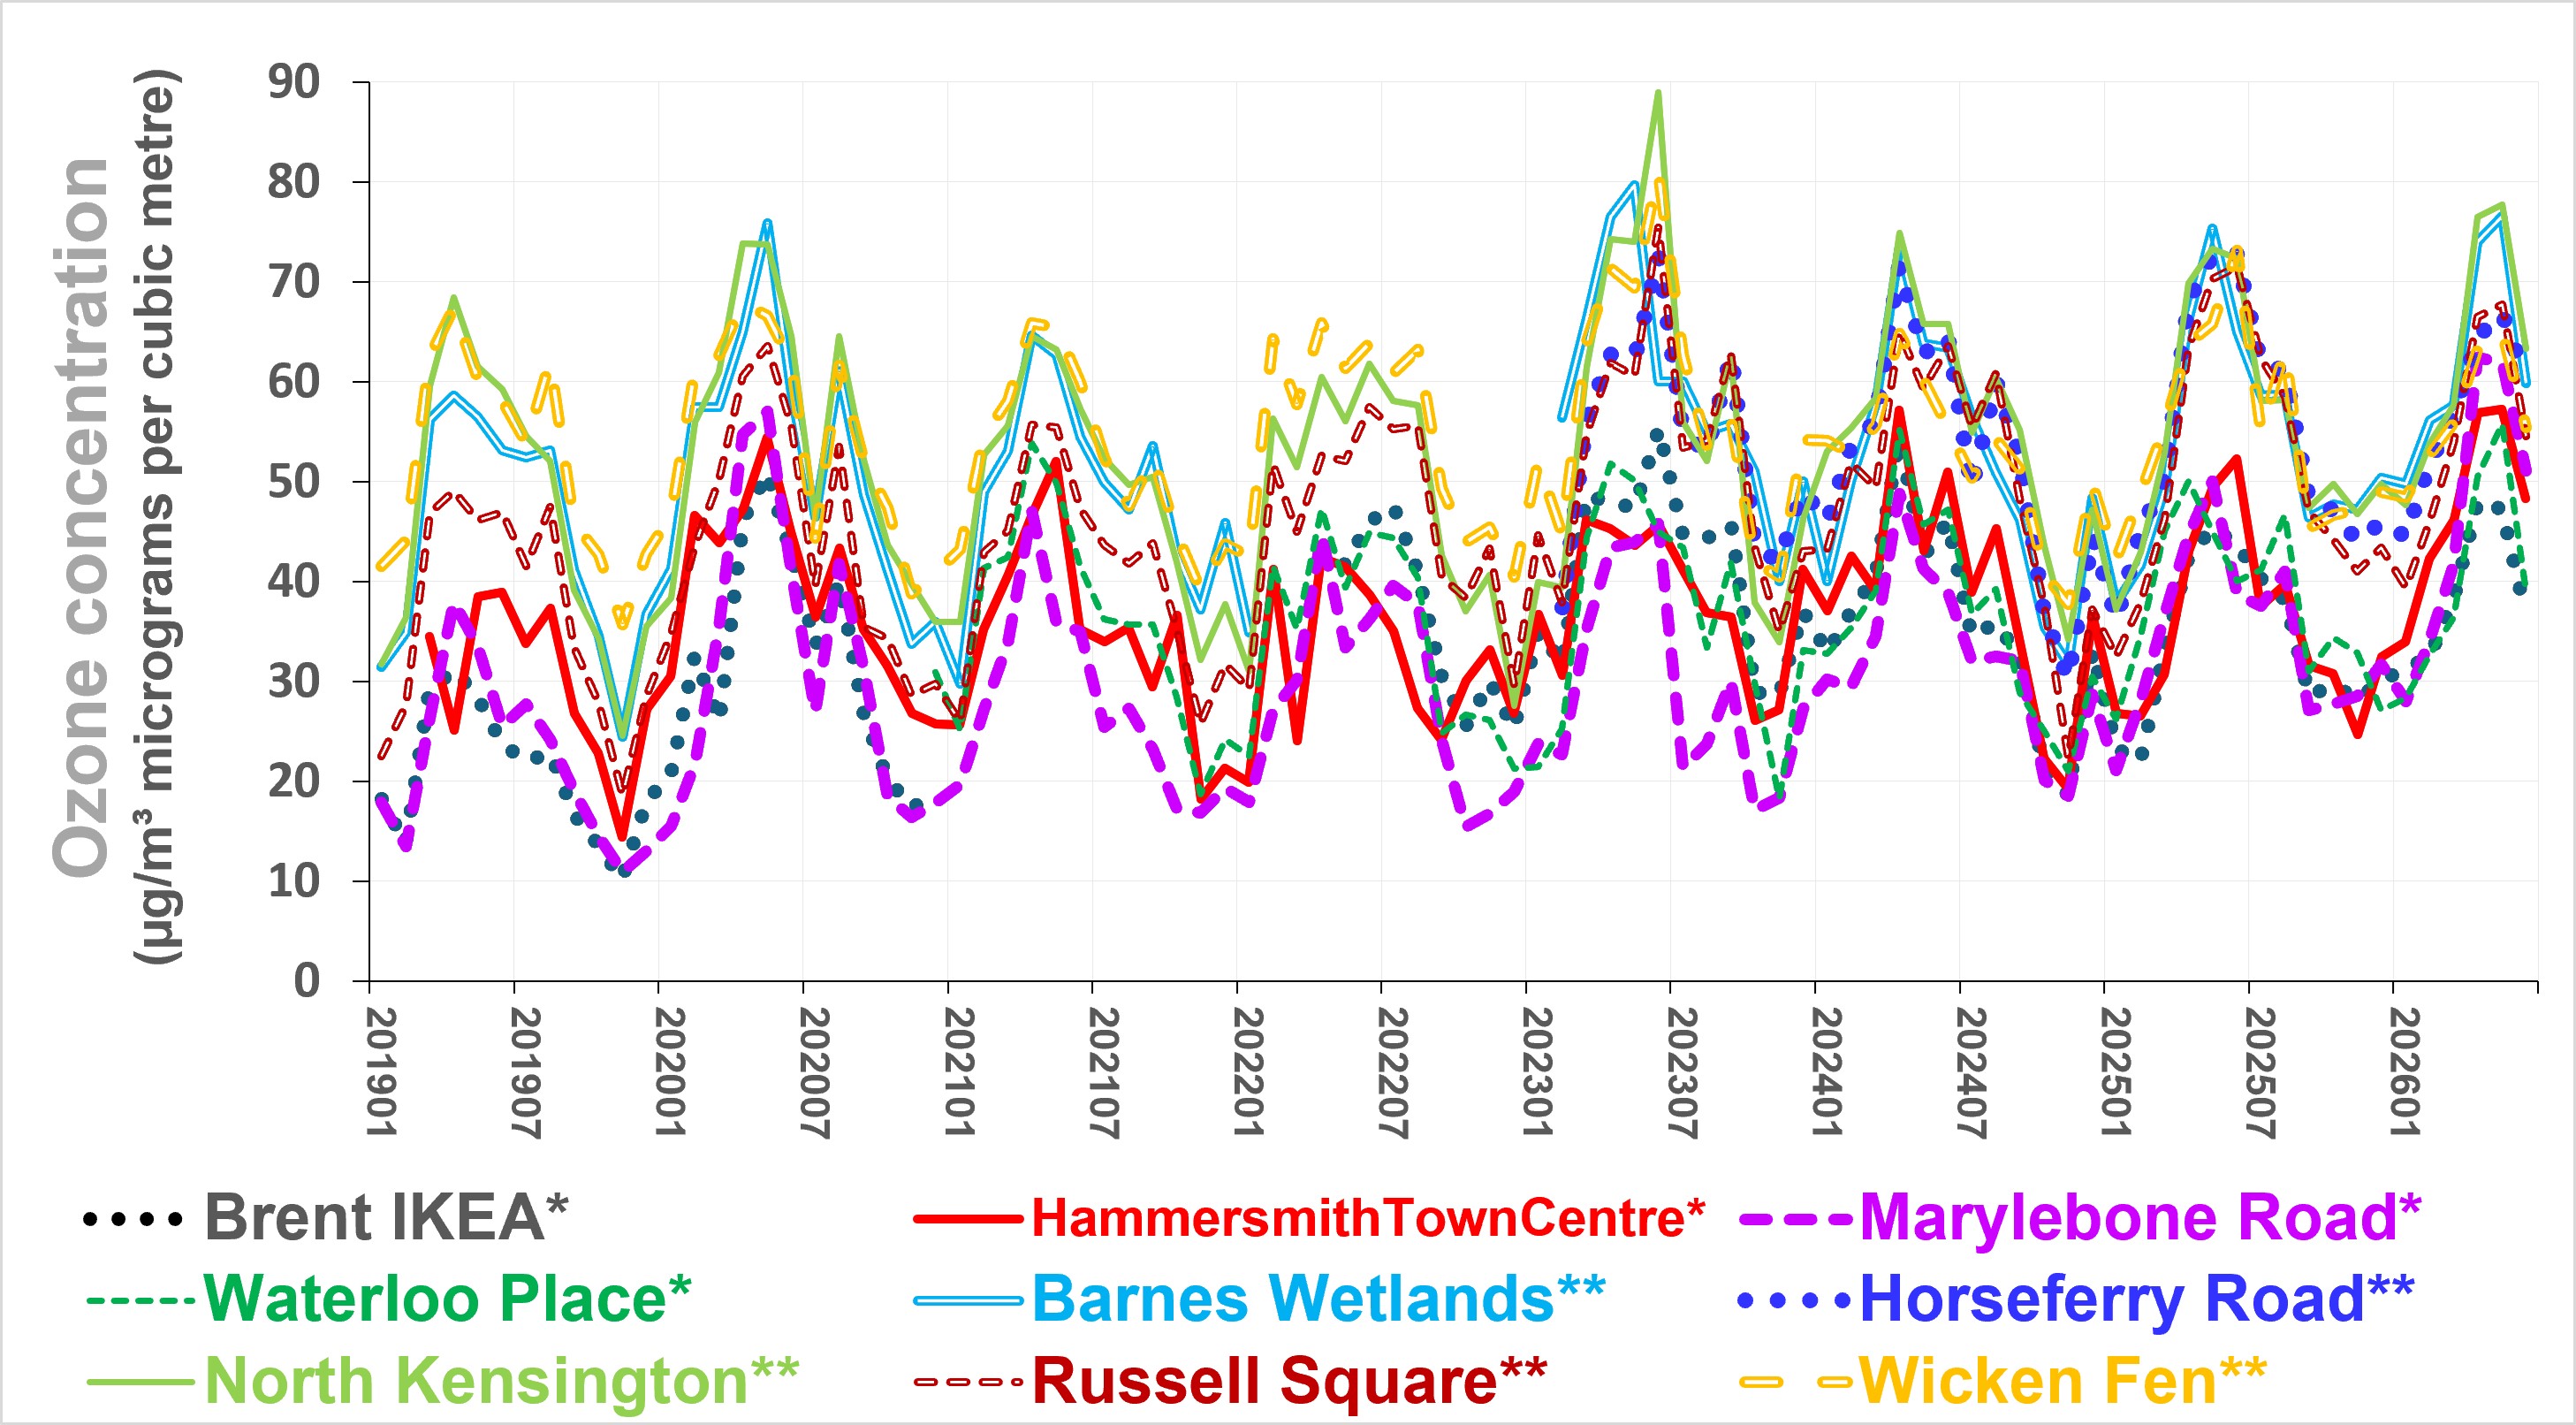 Monthly variation in average ozone concentrations Source: Air Quality England (or London Air) (* busy roadside, ** quiet, background site) [data ratified to end Q1 2026] Remarks: clear difference between summer and winter (regardless of NO2 conentration). Measurements in the neighbourhood - by Westminster City Council 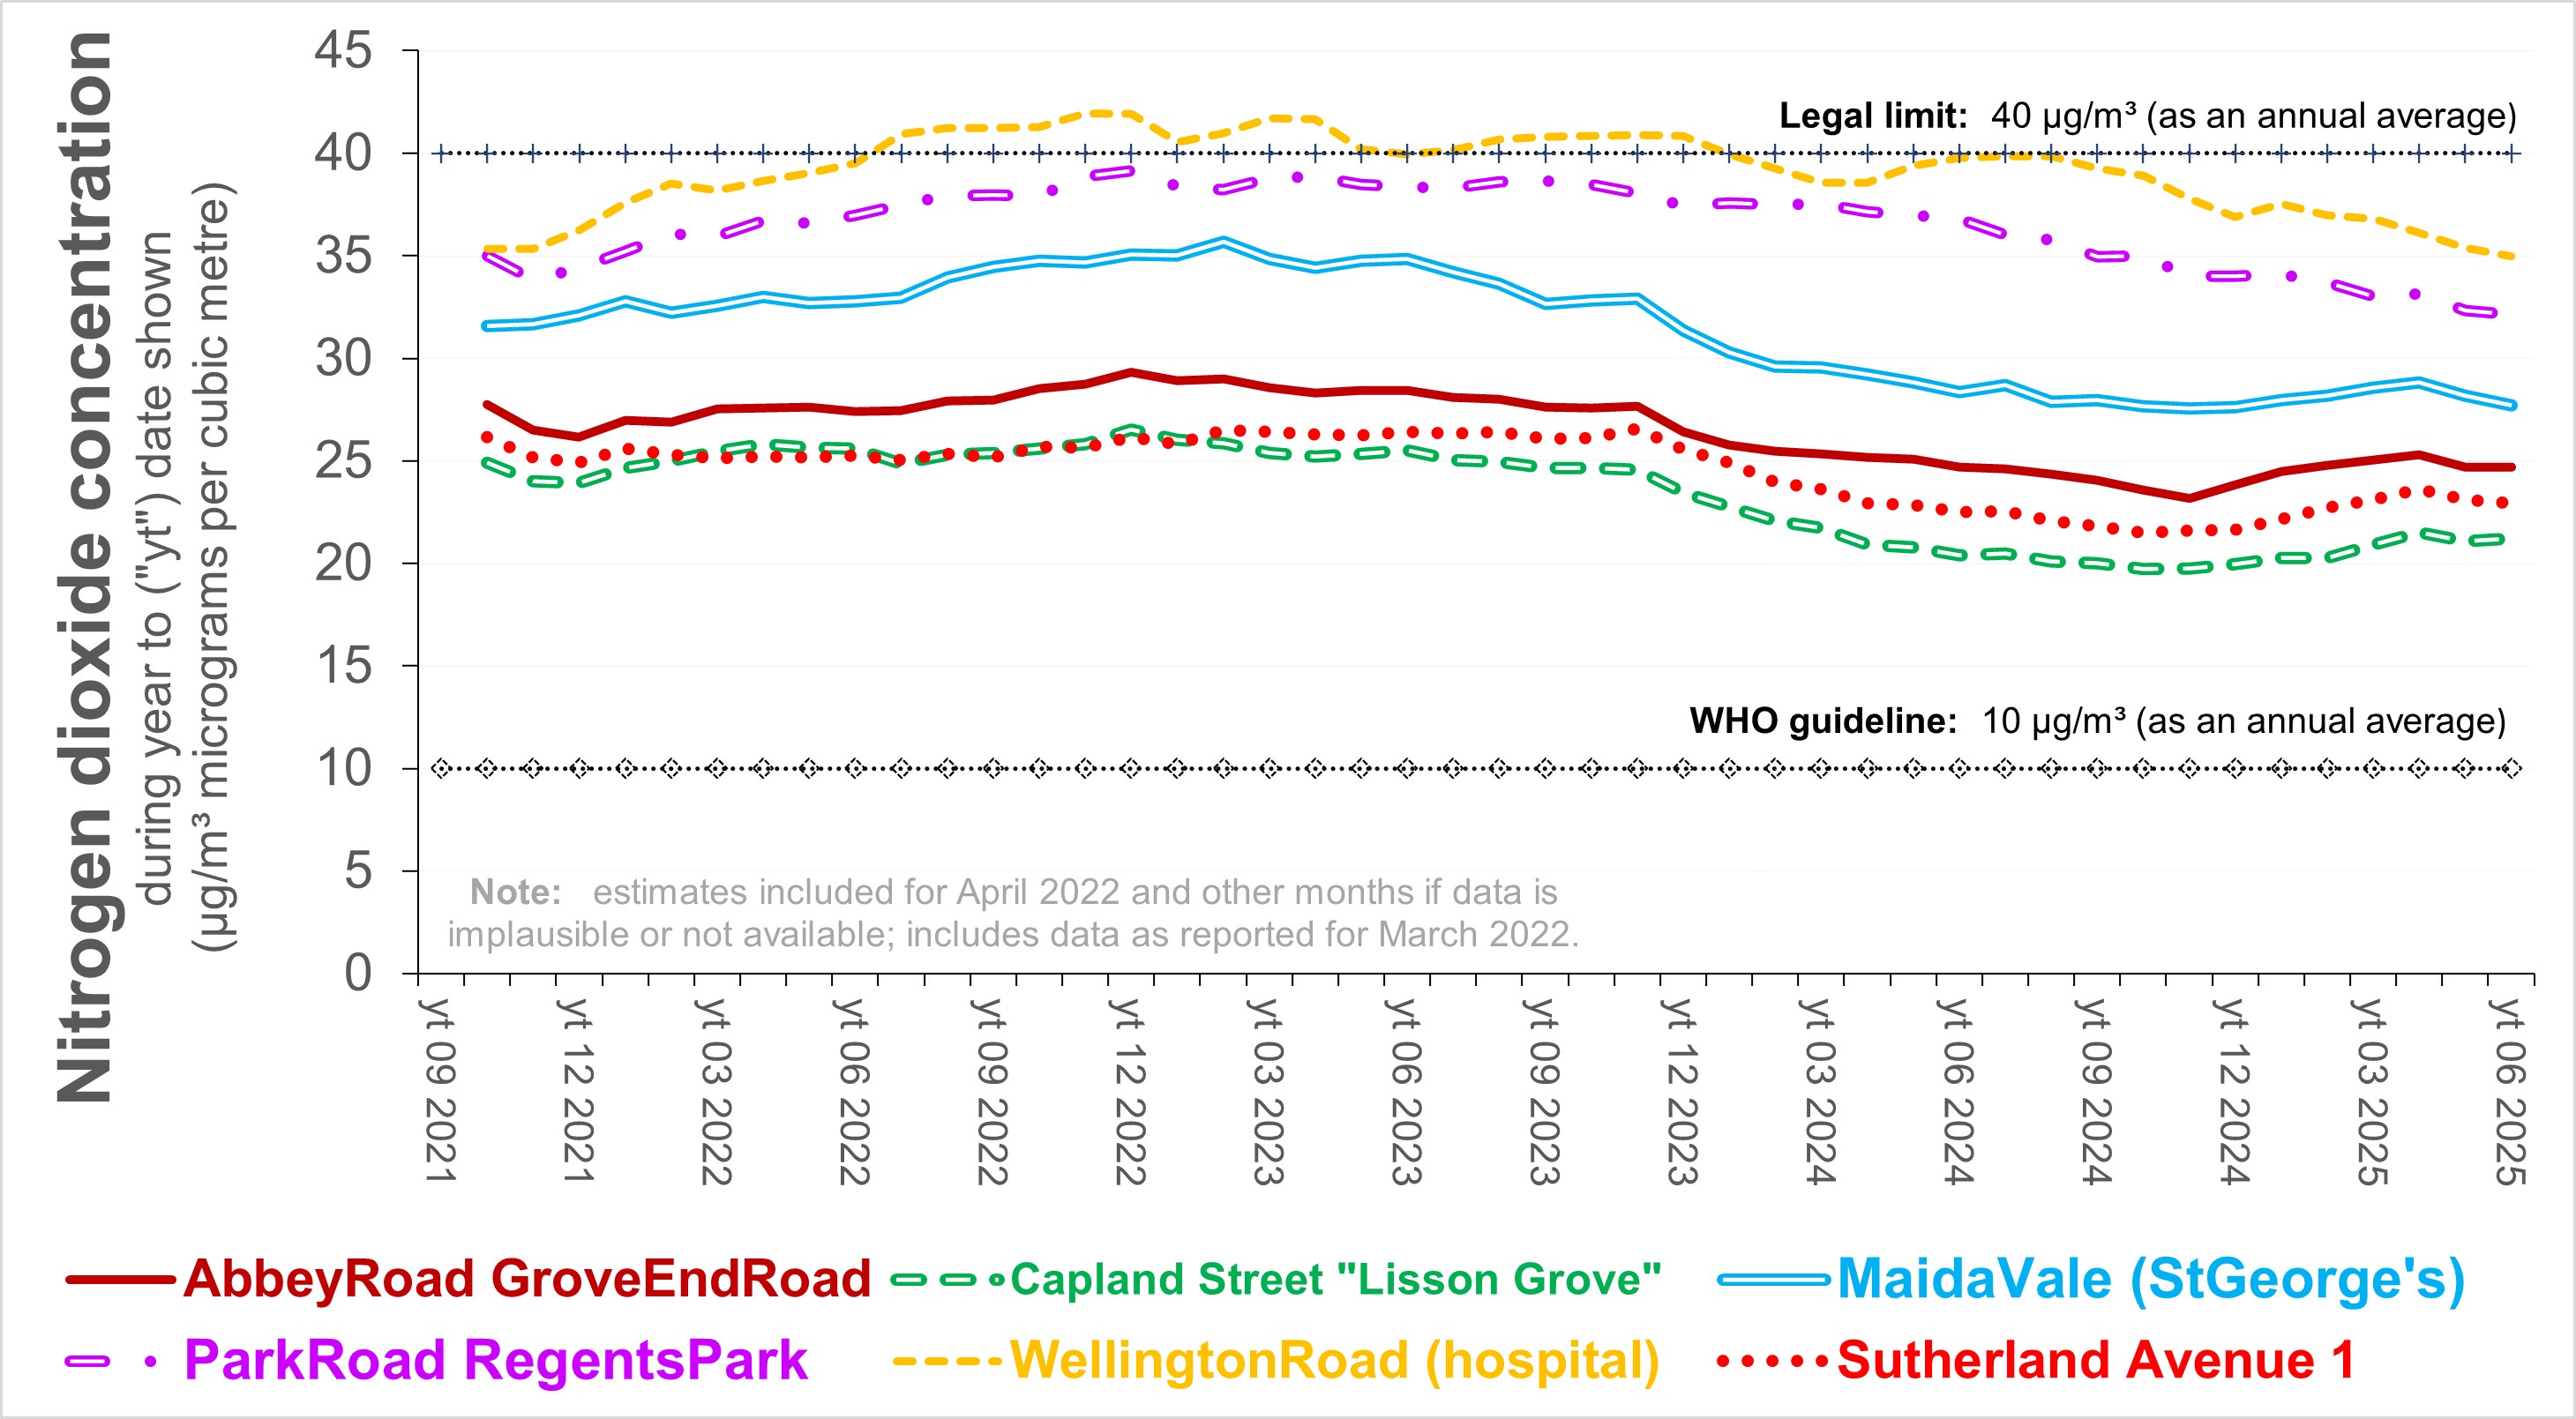 Measurements in the neighbourhood - by HS2 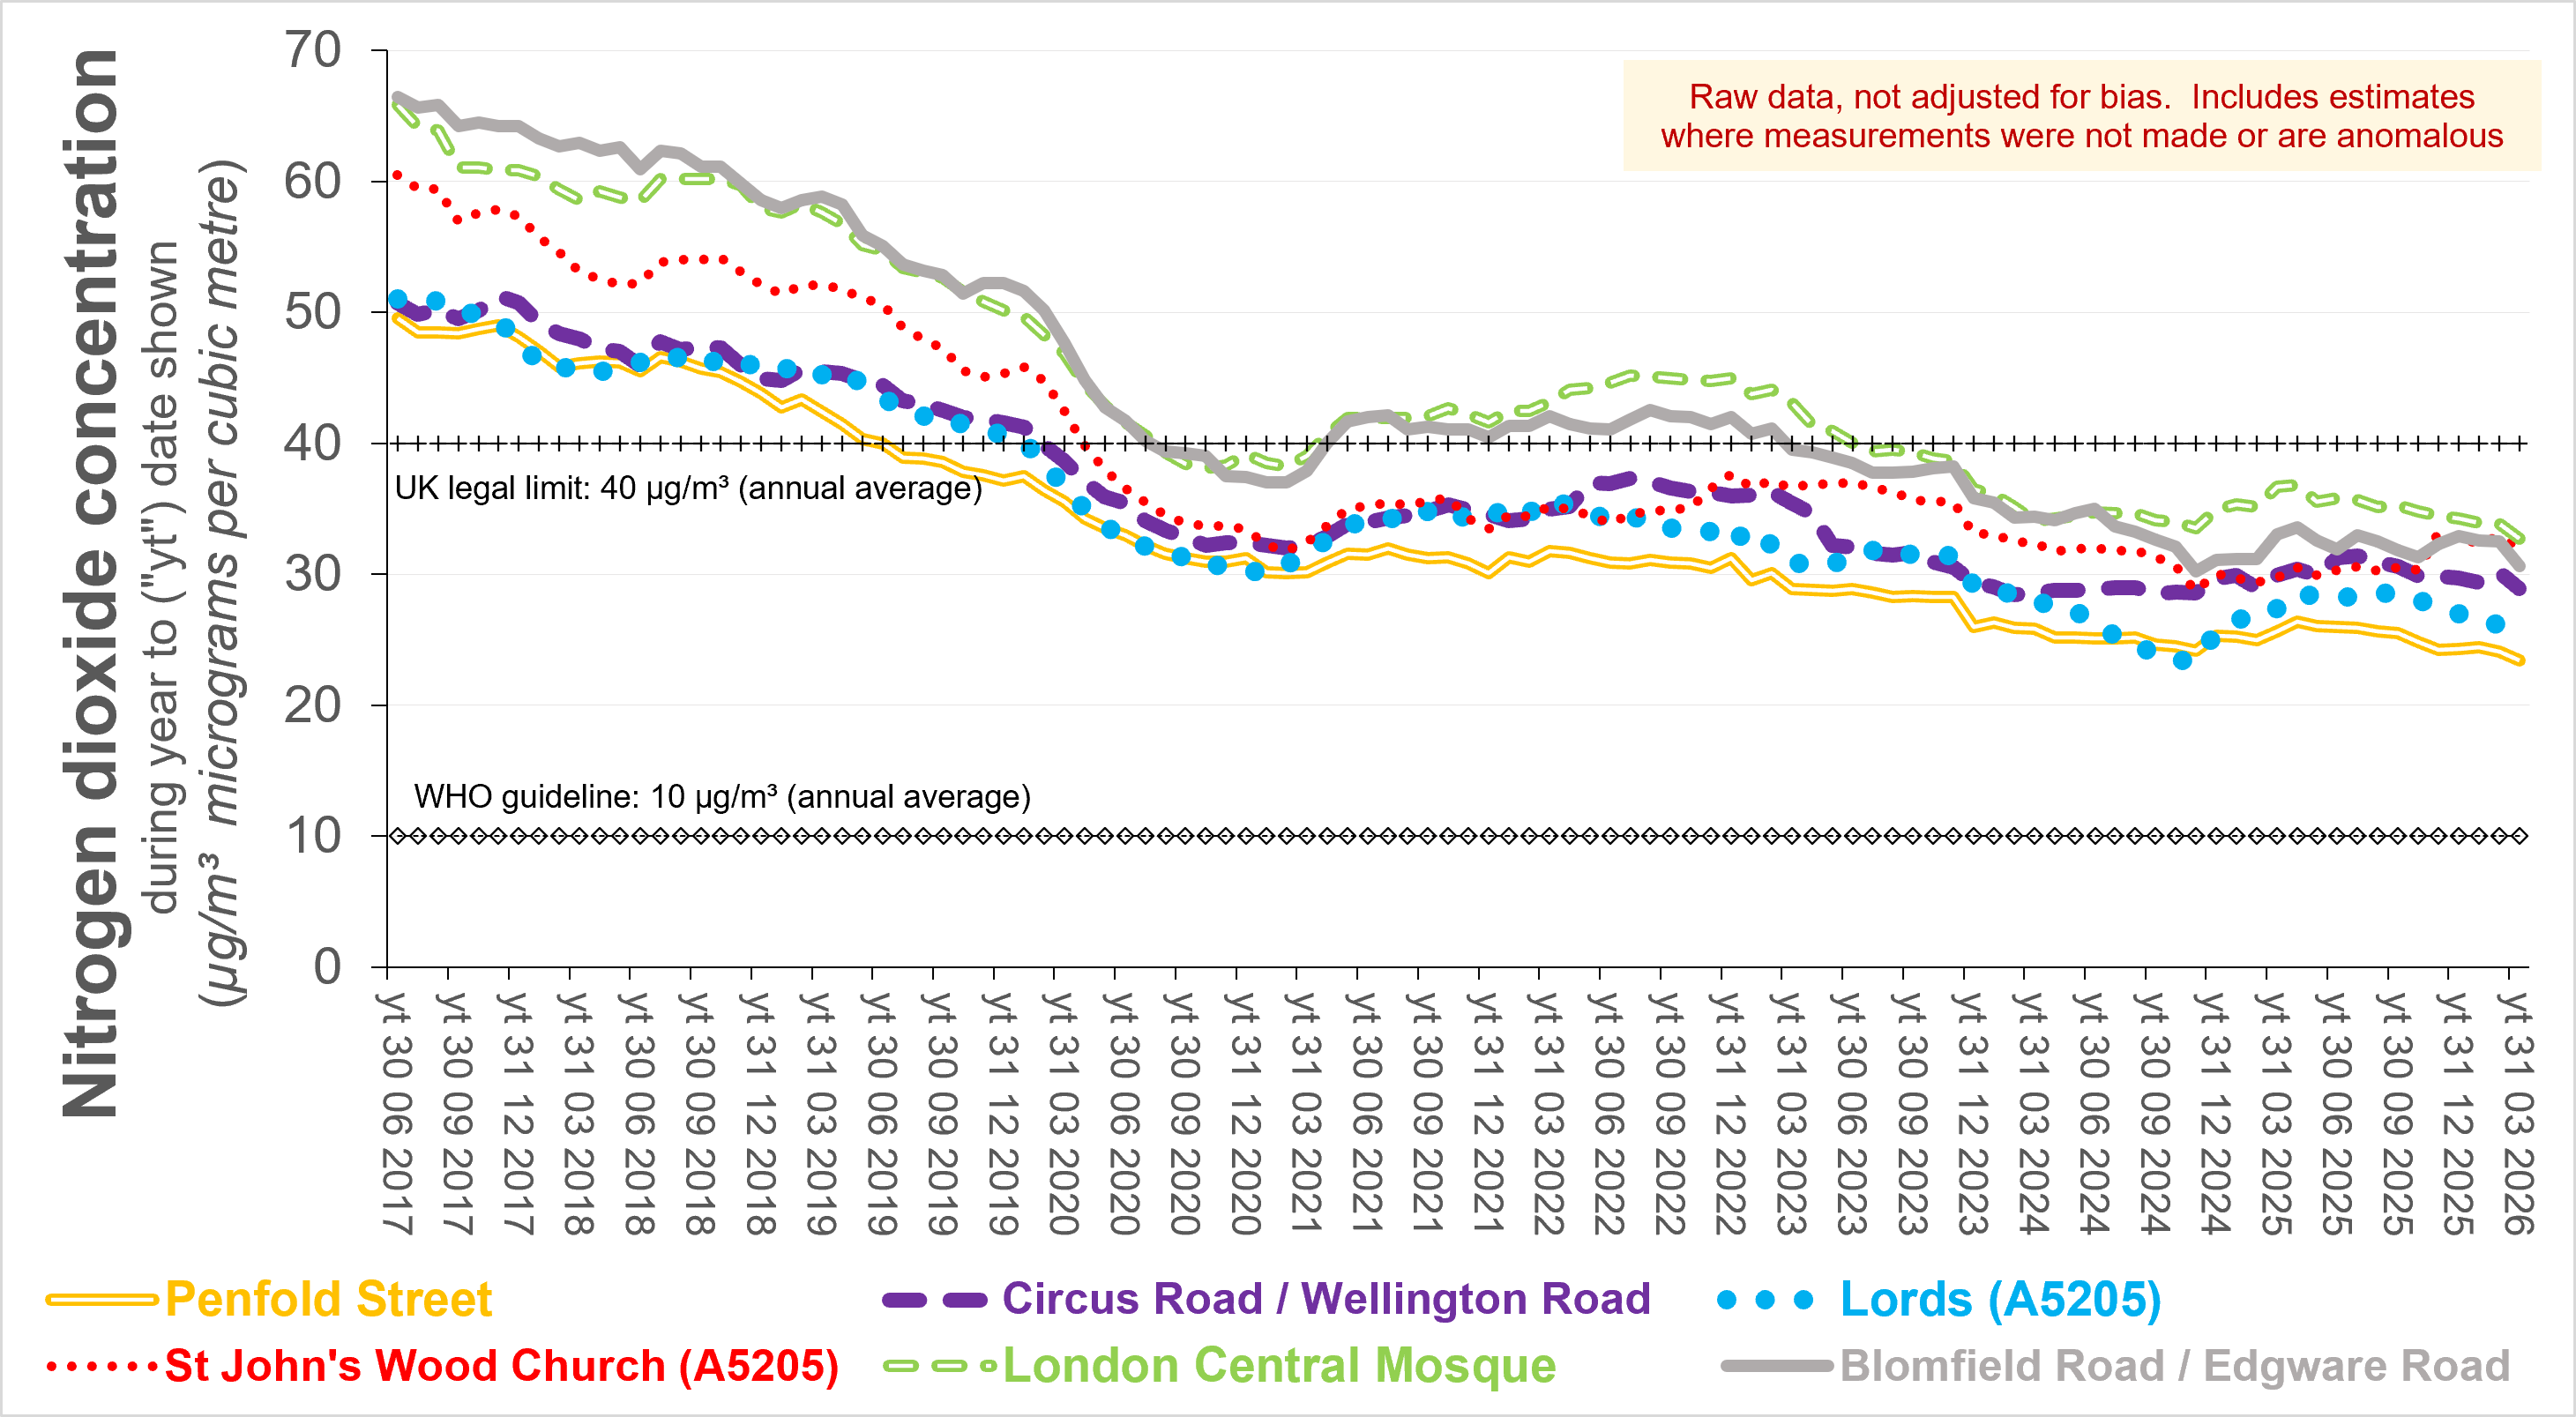 Government estimates for Westminster-wide greenhouse gas emissions Source based on: DESNZ 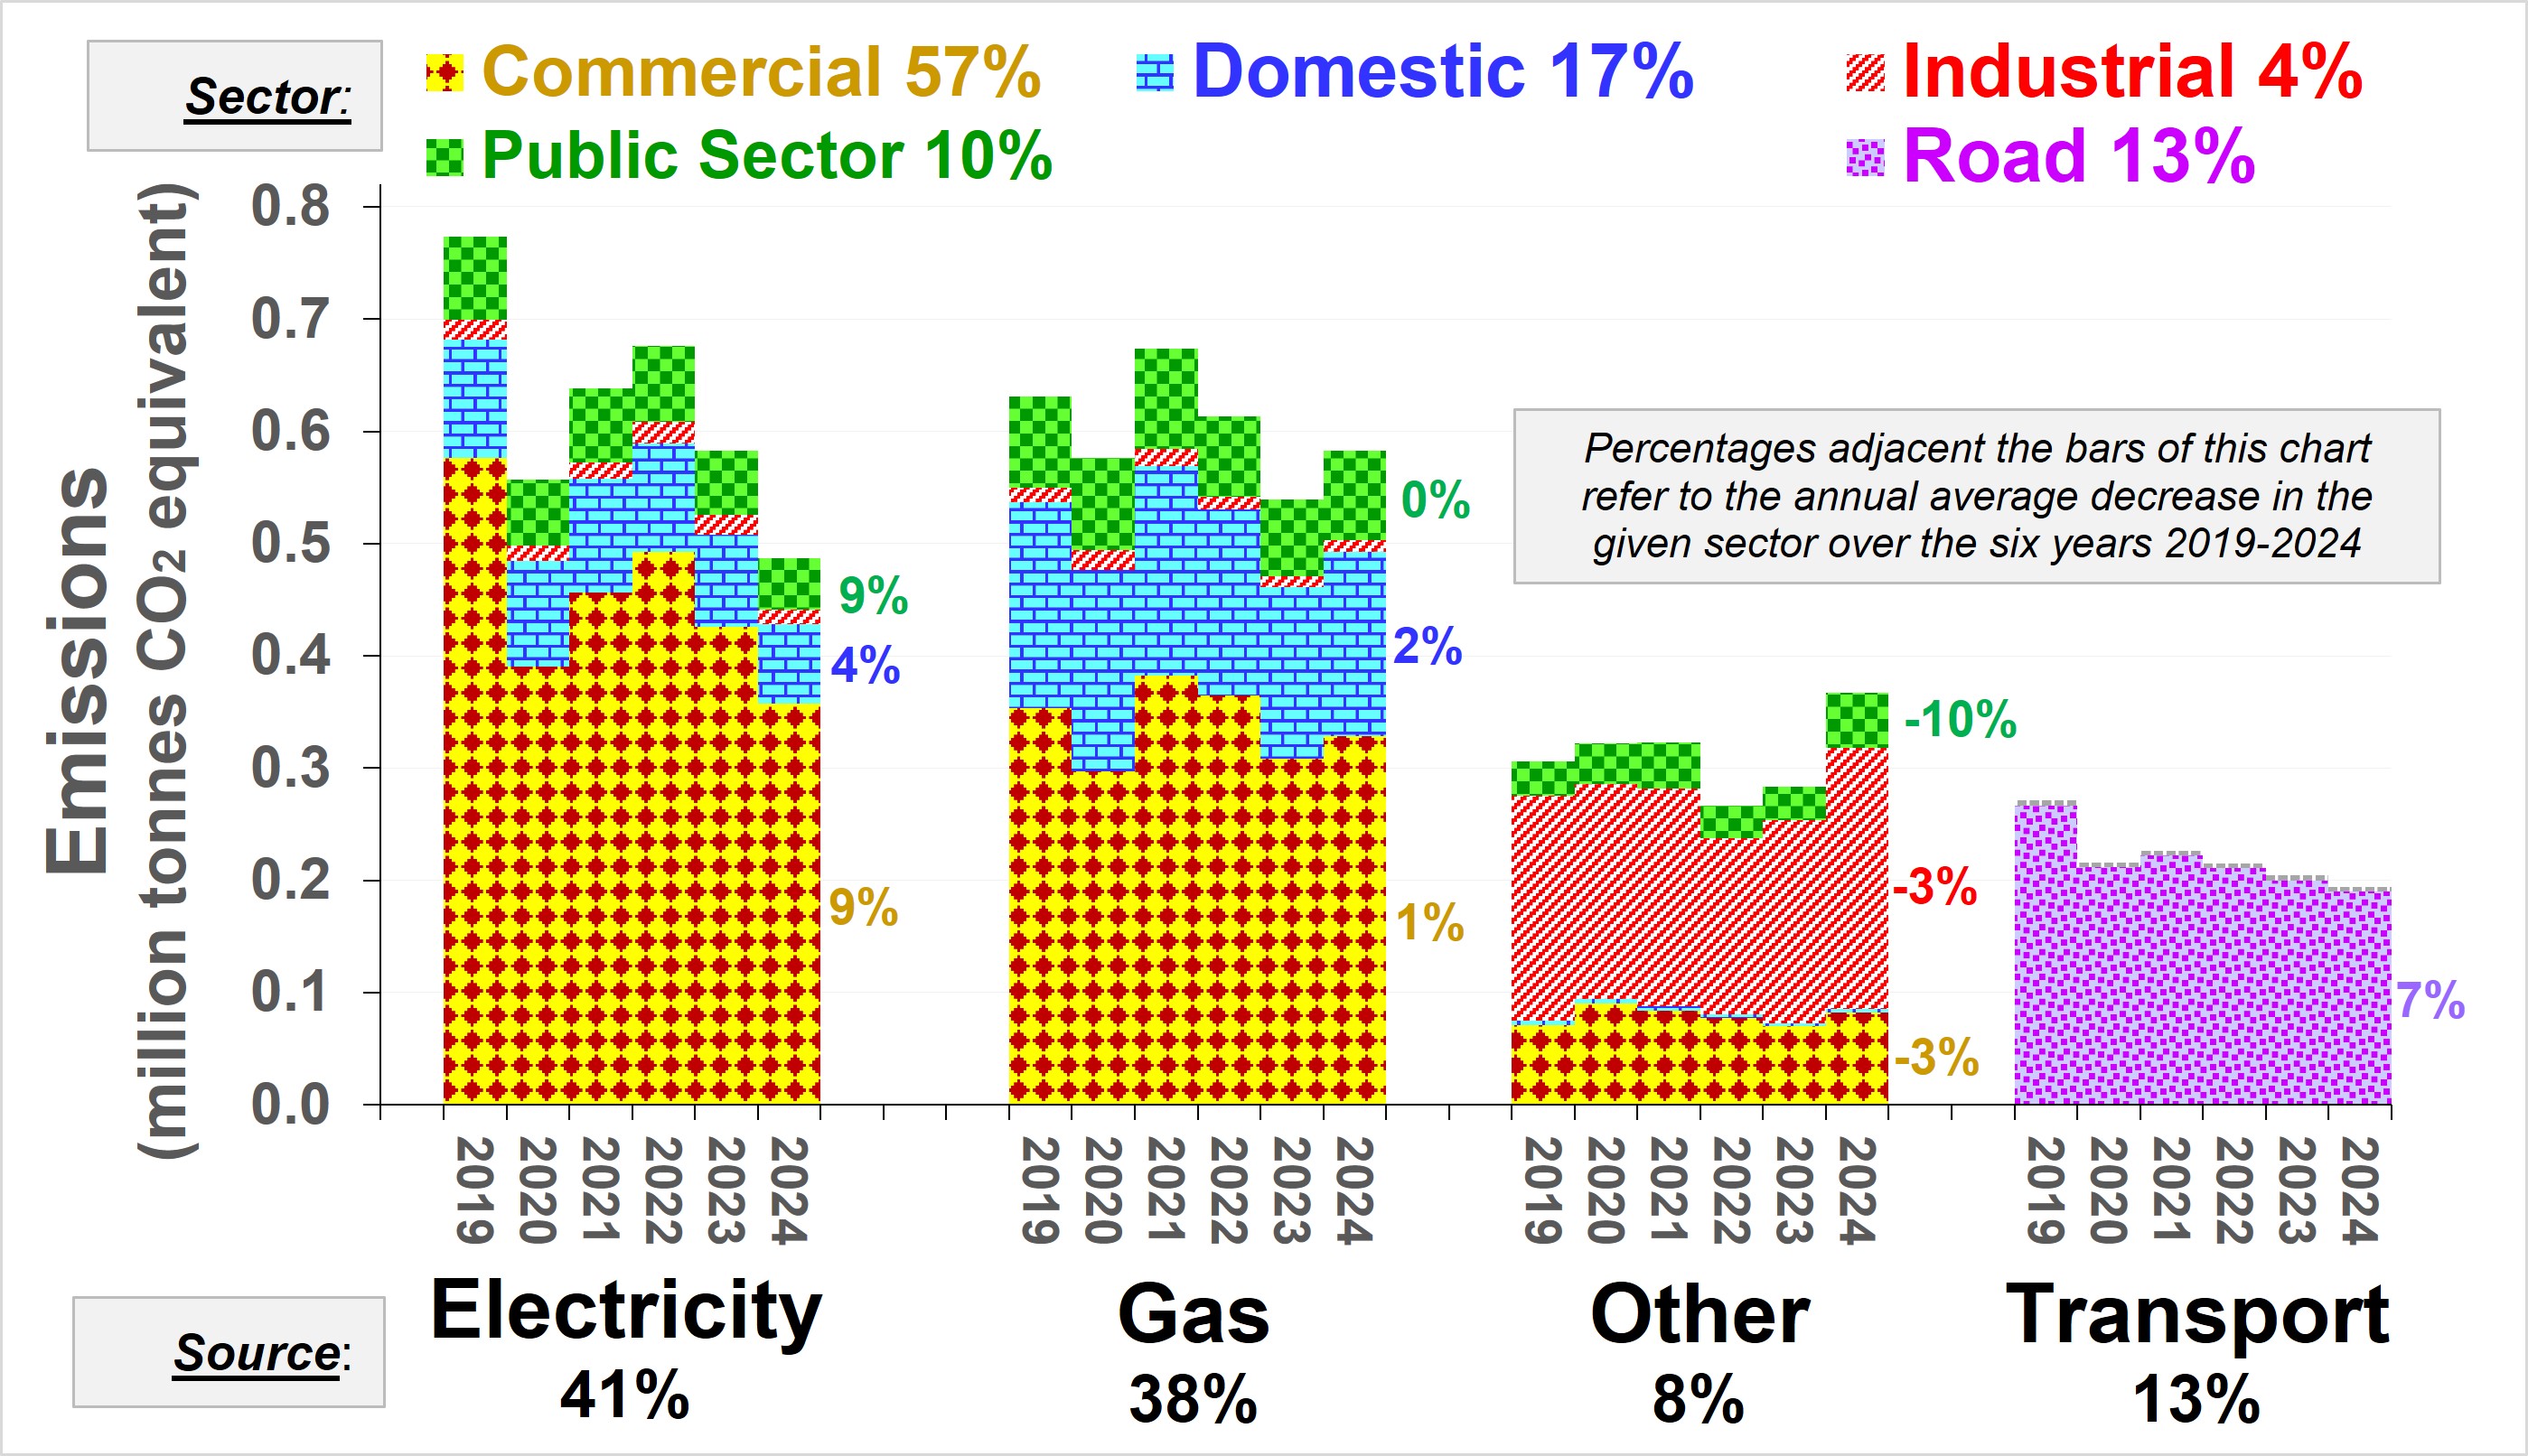 |
||||||||||||||